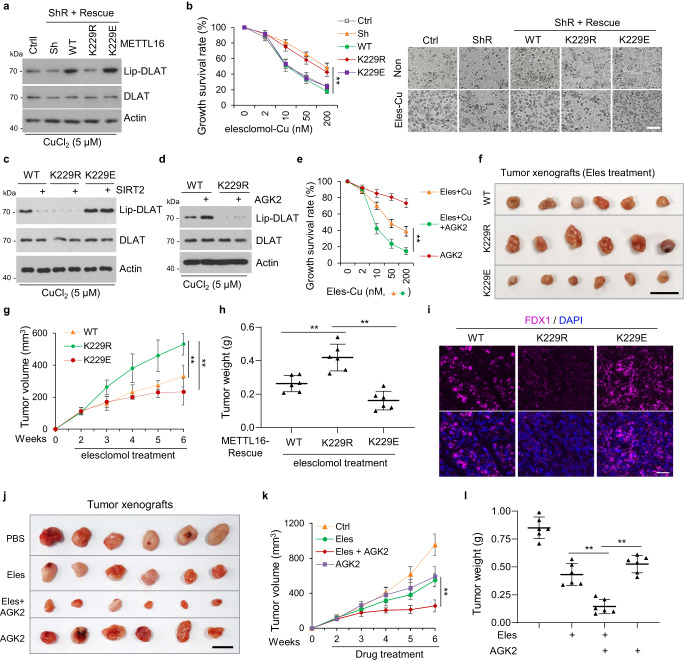
Fig. 7. SIRT2–METTL16–FDX1–cuproptosis axis support a promising therapeutic strategy.
a Western blot analysis of lipoylated DLAT (lip-DLAT) expression in METTL16-knockdown and -rescue (WT, K229R, K229E) HGC-27 cell lines. b METTL16-knockdown and WT/K229R/K229E rescued HGC-27 cell lines were treated with different concentrations of elesclomol-Cu (1:1 ratio). The growth survival in these cells was detected by CCK8 assay (left) and was observed by microscope (right) (n = 3). P = 0.00987 (WT-Sh), 0.00176 (K229R-Sh), and 0.00333 (K229E-Sh). Scale bar, 50 μm. c SIRT2 was transfected in METTL16-WT, -K229R, or -K229E rescued HGC-27 cells, and the lip-DLAT was detected by western blot. d METTL16-WT and -K229R rescued HGC-27 cells were treated with different concentrations of elesclomol-Cu (1:1 ratio) in the presence or absence of AGK2 (10 μM) and the lip-DLAT, DLAT, and Actin was detected by western blot. e HGC-27 cells were treated with different concentrations of elesclomol-Cu (1:1 ratio) in the presence or absence of AGK2 and the growth survival rate was detected by CCK8 assay (n = 3). P = 0.00244. f–i Xenograft experiment with METTL16-WT, -K229R, or -K229E rescued HGC-27 cells (n = 6 in each group). Tumors were collected and photographed (f) (scale bar, 1 cm). The growth curve (g) and tumor weights (h) were measured with indicated treatment. P values: P = 0.00579 and 7.84236E−05 (g). P values: P = 0.0052 and 0.00094 (h). i Representative immunohistochemical images showing FDX1 staining in METTL16-WT, -K229R, or -K229E rescued xenograft tumors (scale bar, 50 μm). j–l Xenograft experiment with PBS-, elesclomol-, elesclomol +AGK2- and AGK2-treated HGC-27 cells. Tumors were collected and photographed (j) (n = 6 in each group). The growth curve (k) and tumor weights (l) were measured with or without elesclomol and AGK2 treatment. P values: P = 0.00130 (g), P values: P = 0.00153 and 0.00027 (l). Statistical data presented in this figure show mean values ± SD of three times of independent experiments. Statistical significance was determined by Two-tailed t test, *P < 0.05, **P < 0.01. Source data are provided as a Source data file.

