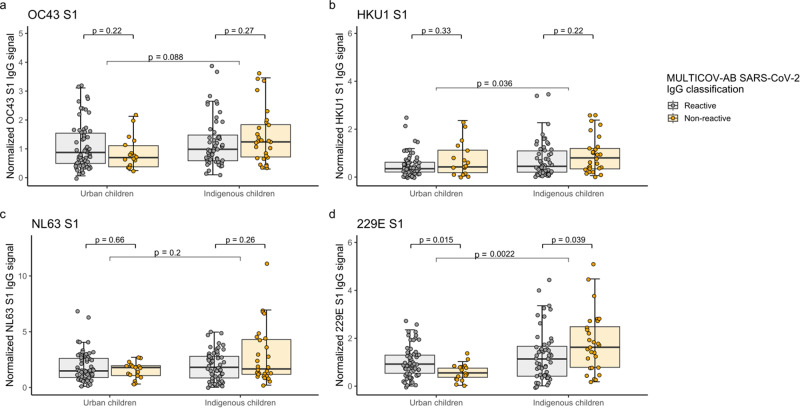
Fig. 2. Humoral immune response towards endemic coronaviruses according to SARS-CoV-2 serostatus in urban and indigenous children.
Humoral IgG responses of urban (n = 80) and indigenous children (n = 82) towards the spike S1 subdomain of OC43 (a), HKU1 (b), NL63 (c), and 229E (d) are split based on SARS-CoV-2 serostatus. Box and whisker plots represent the median, 25th and 75th percentiles. Whiskers show the largest and smallest non-outliers values. Outliers were identified using upper/lower quartile 1.5 ± times IQR. Statistical significance was defined as p < 0.05 using the Wilcoxon’s ranked sum test.

