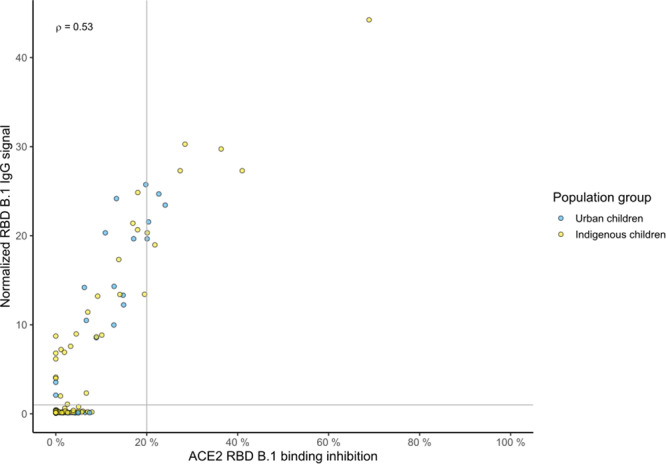
Fig. 3. Correlation of IgG binding and ACE2 binding inhibition for the SARS-CoV-2 B.1 RBD.

Correlation analysis of ACE2 binding inhibition and IgG binding from sera samples of children from urban Bogotá (n = 80, blue) and from the indigenous Wiwa (n = 82, yellow) was performed for the RBD of the B.1 isolate. Correlation analysis was performed across all samples. The resulting Spearman’s coefficient is shown in the upper left quadrant. Dashed lines indicate the ACE2 responder threshold of 20% and the S/CO of 1 for the RBD B.1 antigen.
