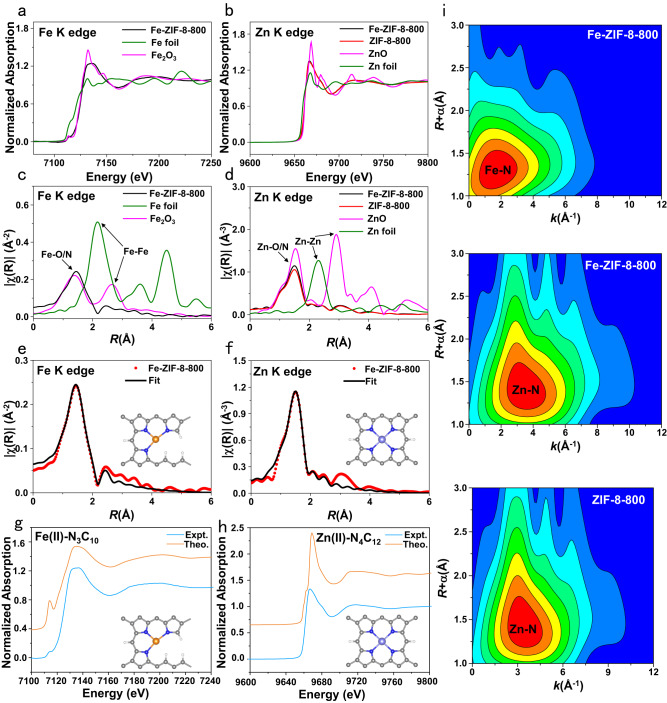
Fig. 2. Experimental and simulation X-ray absorption spectra and analysis.
Fe K-edge (a) and Zn K-edge (b) normalized X-ray absorption near-edge structure (XANES) spectra. Fourier transform of k-weighted Fe K-edge (c) and k2-weighted Zn K-edge (d) EXAFS spectra. e, f EXAFS fitting of the Fe-ZIF-8-800 at Fe and Zn K-edges. g Experimental Fe K-edge XANES spectra of Fe-ZIF-8-800 and theoretical spectra of porphyrin-based Fe(II)-N3C10 moiety. h Experimental Zn K-edge XANES spectra of ZIF-8-800 and theoretical spectra of the porphyrin-based Zn(II)-N4C12 moiety. The number in the bracket represents the formal oxidation state of the metal center. i Wavelet transform of Fe K-edge EXAFS for Fe-ZIF-8-800 and Zn K-edge EXAFS for Fe-ZIF-8-800 and ZIF-8-800. Insets: atomic structure models of Fe SAs/N-C; Fe (orange), Zn (light blue), N (blue), and C (gray).

