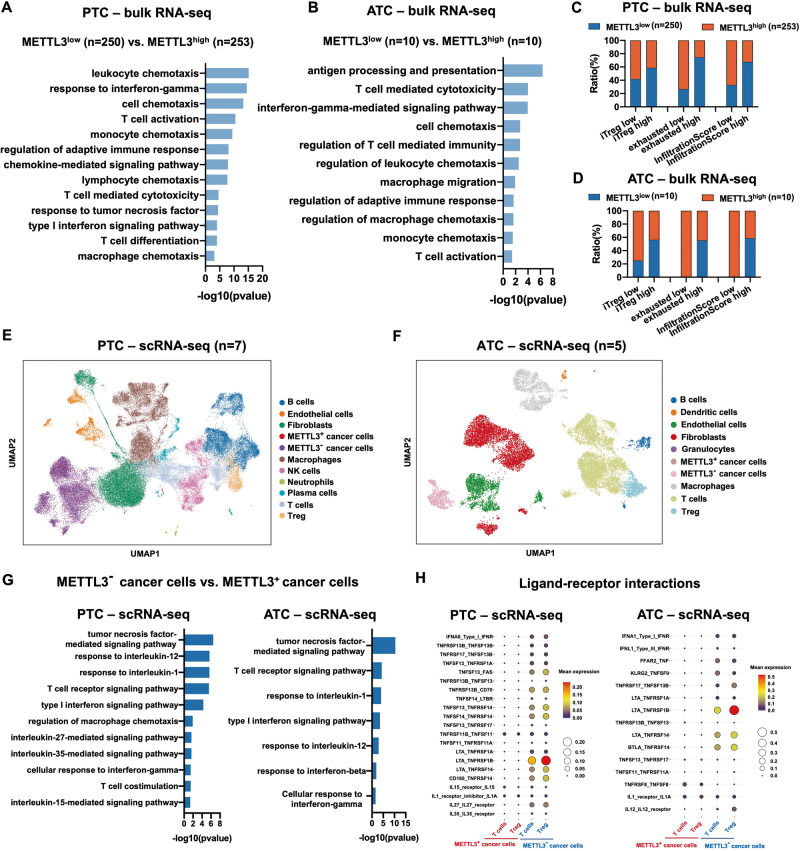
Fig. 1. Low METTL3 expression in PTC and ATC leads to an immunosuppressive TME and resistance to ICB therapy.
A, B GO analysis of the bulk RNA-seq data showing enriched pathways and (C, D) ImmuCellAI analysis showing immune cell infiltration in the METTL3low and METTL3high PTC and ATC tissues (PTC: METTL3low group n = 250, METTL3high group n = 253; ATC: METTL3low group n = 10, and METTL3high group n = 10). E, F Identification of infiltrating cell types in PTC (n = 7) and ATC (n = 5) tissues using scRNA-seq data. G GO analysis of enriched pathways and (H) bubble plots showing TNF, IFN, IL-1 and IL-12-related ligand-receptor interactions in T cells and Tregs in the METTL3+ and METTL3− PTC and ATC tissues.

