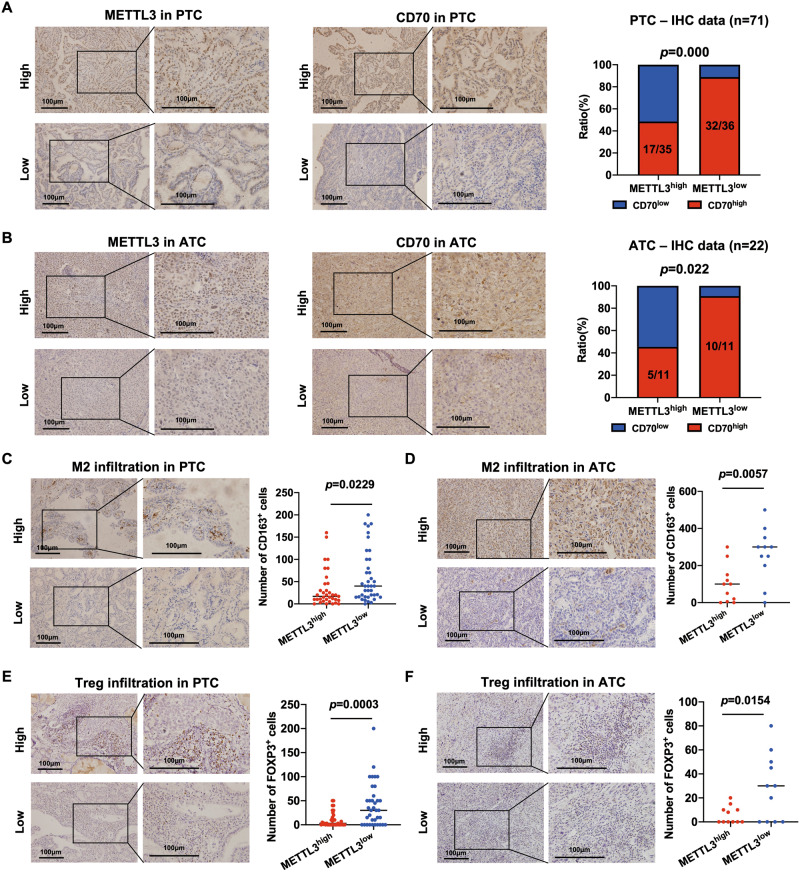
Fig. 7. METTL3 expression negatively correlates with CD70 expression and M2 macrophages and Tregs infiltration in PTC and ATC tissues.
(A-B) Representative IHC images showing in situ METTL3 and CD70 protein expression in PTC (n = 71) and ATC (n = 22) tissues. The chi-square test was used to analyze the correlation between METTL3 and CD70 expression. (C-D) Representative IHC images showing CD163+ M2 macrophages in PTC and ATC tissues. (E-F) Representative IHC images showing Foxp3+ Tregs in PTC and ATC tissues. Scale bars, 100 μm. The p-values in panel C, D, E and F were calculated by Student’s t-test. *P < 0.05, **P < 0.01, ***P < 0.001.

