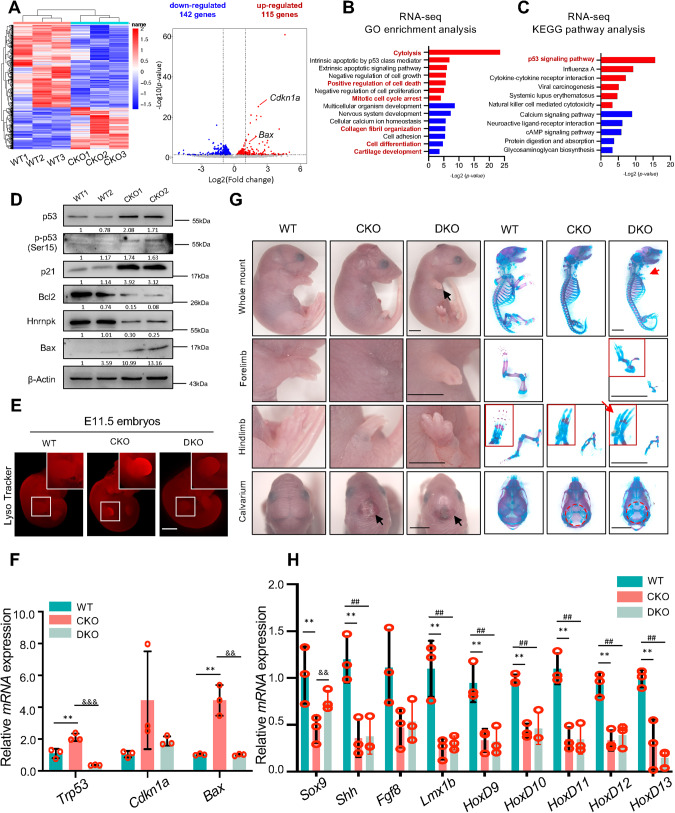
Fig. 3. Knocking out Trp53 in CKO mice is incapable of rescuing the phenotype.
A Heatmap and volcano plot of RNA-seq using E11.5 WT and CKO limb buds. Three biological replicates were included. GO enrichment analysis (B) and KEGG pathway analysis (C) of differentially expressed genes (p value < 0.05) with fold change >2 of < 0.5. The items highlighted were the items we focus on. D Protein level of genes involved in the p53 signaling pathway, including p53, phosphate p53, p21, Bcl2, Hnrnpk, and Bax at E11.5 in WT and CKO limb buds. β-Actin as the loading control. Densitometry results were expressed as fold change in protein levels compared with WT1 after normalized to β-Actin. E Representative images of Lyso tracker staining of E11.5 WT, CKO, and DKO embryos. The white boxes indicated the magnification of the forelimbs. Scale bar: 1 mm. F qPCR results indicated the elevated RNA expression of Trp53, Cdkn1a, and Bax at E11.5 in CKO limb bud were reversed at E11.5 in DKO limb bud. N = 3 biological replicates. G Representative general observation and skeletal preparation of E18.5 WT, CKO, and DKO mice. The red boxes represented the magnification of the figure to show the details. The black arrows indicated the abnormal forelimbs and calvarium in DKO embryos. The red arrows indicated the partial recovery detected in DKO embryos. The red dotted circles indicated the missing calvarium. Scale bar: 1 mm. H qPCR results confirmed that decreased expression of Shh, Fgf8, Lmx1b, and HoxD9-13 at E11.5 in CKO limb buds still existed at E11.5 in DKO limb bud. N = 3 biological replicates. The p value was calculated by one-way ANOVA with Tukey’s post-hoc test. Data were shown as mean ± SD. Statistical analysis was performed in WT and CKO embryos (indicated as **p < 0.01), or CKO and DKO embryos (indicated as && p < 0.01, &&& p < 0.001), or WT and DKO embryos (indicated as ## p < 0.01).

