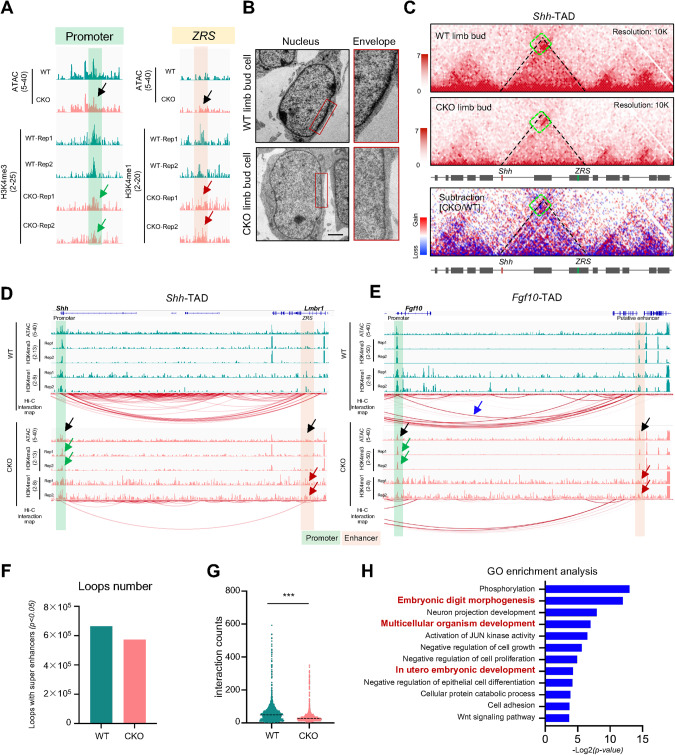
Fig. 5. Hnrnpk ablation weakens the interactions between promoters and enhancers.
A Genome browser tracks of ATAC-seq data, H3K4me3 and H3K4me1 CUT&RUN-seq data at Shh promoter and Shh enhancer ZRS at E11.5 in WT and CKO limb buds. The black arrows indicated decreased ATAC peaks. The green arrows indicated decreased H3K4me3 peaks in the promoter regions of the CKO groups. The red arrows indicated decreased H3K4me1 peaks in the enhancer regions of the CKO groups. B Representative electron microscope images of E11.5 WT and CKO limb bud. The red boxes indicated the magnification of the nuclear envelope. Scale bar: 2 μm. C Hi-C heatmap at Shh-TAD. The green boxes indicated the contact heatmap between Shh and ZRS at E11.5 in WT and CKO limb bud cells. D, E ATAC-seq data, H3K4me3, and H3K4me1 CUT&RUN-seq data, and Hi-C interaction map at Shh- (D) and Fgf10- (E) TADs. The black arrows indicated decreased ATAC peaks in the CKO groups. The green arrows indicated decreased H3K4me3 peaks in the promoter regions of the CKO groups. The red arrows indicated decreased H3K4me1 peaks in the enhancer regions of the CKO groups. The blue arrow indicated the interaction between Fgf10 and its putative enhancer. F Quantity of loops detected at E11.5 in WT and CKO limb bud. G Average loop interaction intensity at E11.5 in WT and CKO limb buds. H GO enrichment analysis of target genes of loop interaction intensity decreased more than 2 folds (Log2FC < −1) detected at E11.5 in CKO limb buds compared to WT. The p value was calculated by two-tailed unpaired Student’s t test. Data were shown as mean ± SD. ***p < 0.001.

