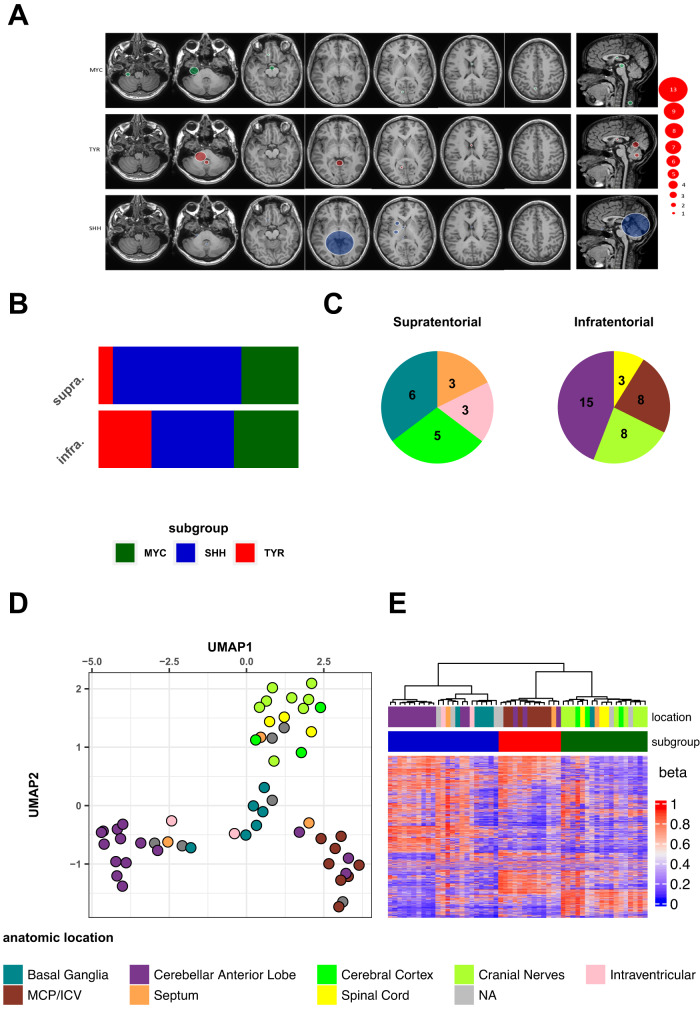
Fig. 1. Radiological description of ATRTs’ epicenter suggests clearly distinct origins for each molecular subtype.
A MRI showing the most frequent tumor locations according to molecular subgroups. The round size indicates the number of tumors. The last column represents the tumors located on the midline, which are not additional cases, except the spinal MYC tumors. The different colors correspond to the molecular subgroups based on DNA methylation data (DKFZ brain tumor classifier v11b4): MYC (green), TYR (red) and SHH (blue). B Bar plot showing the distribution of the different molecular groups assigned according to the DNA methylation profile at the supra- and infratentorial level. C Pie charts showing the distribution of the different ATRT anatomical locations at infra and supratentorial levels. NA: not available anatomical location. The color code is referred to at the bottom of Fig. 1. MCP/ICV: middle cerebellar peduncle and inferior cerebellar vermis. D UMAP analysis performed on human ATRT DNA methylation array data. E Unsupervised hierarchical clustering of ATRT samples based on DNA methylation data. Top annotation indicates ATRT anatomical location and molecular subgroup. Source data are provided as a Source Data file.

