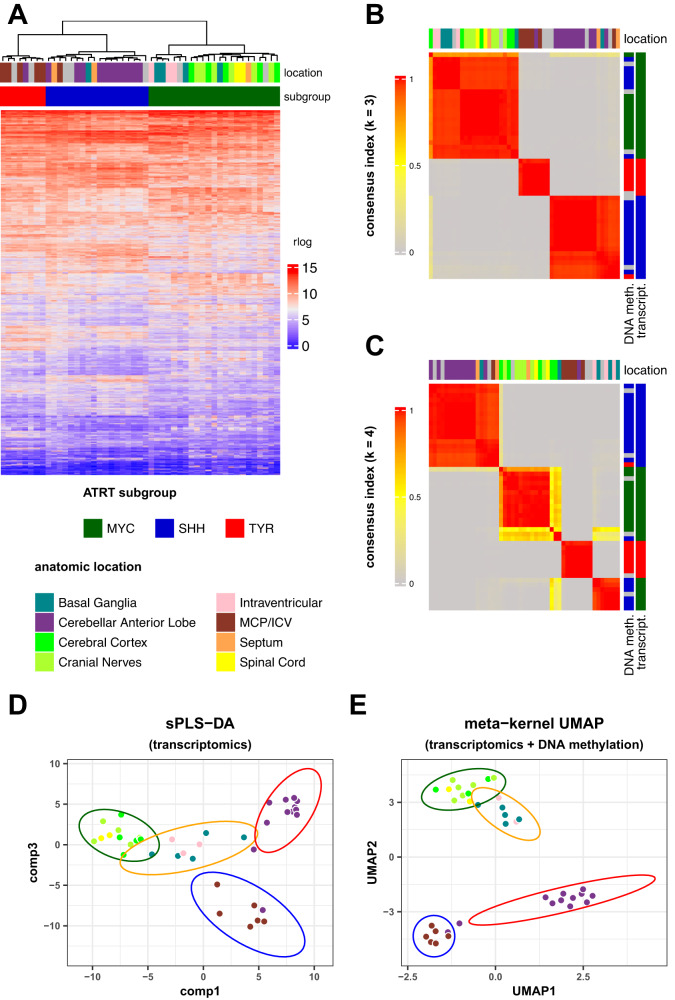
Fig. 2. Integrative analysis identified four anatomical-molecular subgroups and splits SHH ATRT in two subgroups with distinct anatomical locations and transcriptional profiles.
A Unsupervised hierarchical clustering of human ATRT samples based on RNAseq dataset. Anatomic location as well as the assigned RNAseq subgroup for each sample is indicated in the top annotations. B, C Consensus clustering of human ATRT samples based on RNAseq data with k = 3 (B) and k = 4 (C). D UMAP of human ATRT based on the integrated DNA methylation and transcriptomics datasets (kernel-based approach). Points indicate tumor samples, colors indicate anatomic location and the ellipses indicate tumor anatomical-molecular subgroups. E sPLS-DA individual plot using the two major components (comp, comp 1, and comp3). Points indicate tumor samples, colors indicate anatomic location and the ellipses indicate tumor anatomical-molecular subgroups. sPLS-DA was applied on RNAseq data. Source data are provided as a Source Data file.

