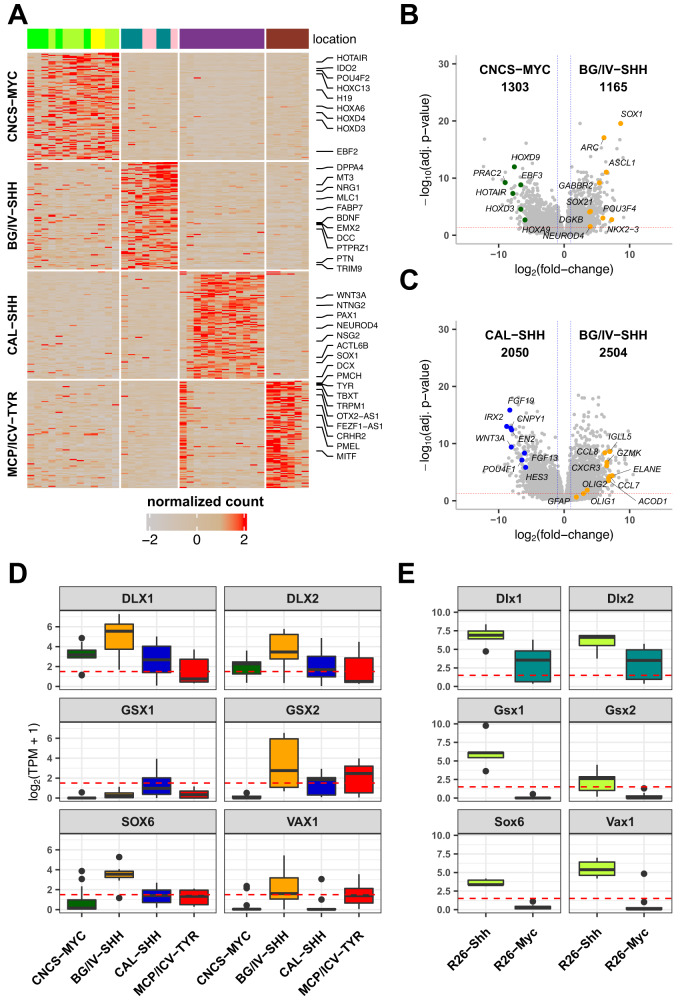
Fig. 4. BG/IV SHH ATRT and murine Shh ATRT show a unique expression pattern suggesting a ganglionic eminence origin.
A Heatmap of gene expression using the 100 most differentially expressed genes between anatomical-molecular subgroups in a “one versus all others” manner. Top annotation indicates sample anatomical location. Genes of interest are listed at the left of the heatmap; expression levels are ranked from the lowest (gray, −2) to the highest (red). B, C Volcano plots showing differential gene expression analysis results of BG/IV SHH versus MYC (b) and BG/IV SHH versus CAL SHH (c). The x axis indicates the log2 transformed fold-change and the y axis indicates the reverse of the log10 transformed adjusted p-value. Horizontal red line corresponds to adjusted p-value equals to 0.05 and two vertical blue lines indicate log2(fold-change) respectively equal to = −1 (left) and 1 (right). Differentially expressed genes of interest are labeled. Negative binomial GLM and Wald test were applied for gene expression comparison and generated p-values were corrected using the Benjamini and Hochberg method. D, E Boxplots of ganglionic eminence gene expression in (A) human ATRT anatomical molecular subgroups (n = 39 total of independent samples: nCNCS-MYC = 13, nBG/IV-SHH = 8, nCAL-SHH = 12, nMCP/ICV-TYR = 6) and in (B) mouse RT subgroups (n = 16 total of independant samples: nR26-SHH = 5, nR26-MYC = 11). x axis indicates subgroups and y axis indicates the level of expression in log2(TPM + 1). The box part of the boxplots represents the interquartile range while the whisker bonds of the boxplots indicate the highest and smallest values within 1.5 times interquartile range above and below the 75th and 25th quantiles respectively. Source data are provided as a Source Data file.

