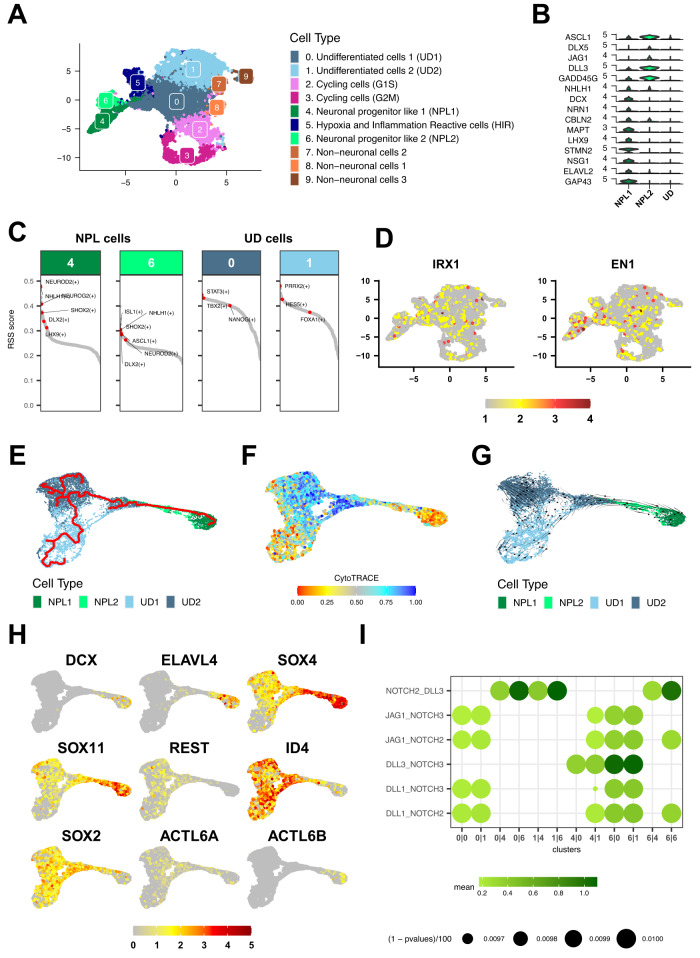
Fig. 7. Single-cell RNAseq analysis reveals transcriptional intra-tumoral heterogeneity of cerebellar anterior lobe ATRTs and neuronal progenitors as putative cells of origin.
A UMAP visualization of the human CAL SHH cell clusters obtained after integration 4 independent samples. Colors distinguish the different clusters; assigned names are reported at the right of the UMAP. B Violin plots showing the specific marker genes for Neuronal progenitor like cells and undifferentiated cells. C Heatmap of Midbrain/Hindbrain boundary gene signatures (IRX1, EN1) expression on the UMAP of integrated human CAL-SHH ATRT samples. D Regulon specificity score (RSS) for each transcription factors (TF) in Neuronal progenitor and undifferentiated cell populations. In each cluster, regulons (TF along with their direct targets) are ordered according to their RSS. Regulons of interest are labeled. E Trajectory inference analysis using the PAGA algorithm (Monocle3) showing a path form NPL1 cluster to UD clusters via NPL2 cells. Color code indicates cell clusters as referred in (A). Dark green: NPL1 cells, light green: NPL2 cells, light blue: undifferentiated cells. F Heatmap of CytoTRACE score at single cell level. The color gradient indicates a differentiated state (red) to an undifferentiated state (blue). G Embedding streams (RNA velocity – scVelo) showing the transcriptional dynamics throughout the trajectory. Genes specifically expressed in NPL1, NPL2, UD1, and UD2 cell clusters were used. Dark green: NPL1 cells, light green: NPL2 cells, light blue: undifferentiated cells. H Heatmap of gene expression showing the gradual expression along the trajectory of neurogenic TFs (SOX4, SOX11), neuronal differentiation genes (DCX, ELAVL4), neuronal repressor (REST), stem cell and pluripotency markers (ID4, SOX2) and the SWI/SNF subunits genes (ACTL6A, ACTL6B). The color gradient indicates the expression levels, from the lowest (gray) to the highest (red). I Dot plot of NOTCH signaling ligand-receptor interaction between two cell clusters. Color gradient indicates the average expression of the ligand-receptor partner in the two clusters while the diameter of the dot indicates the corresponding p-value. Source data are provided as a Source Data file.

