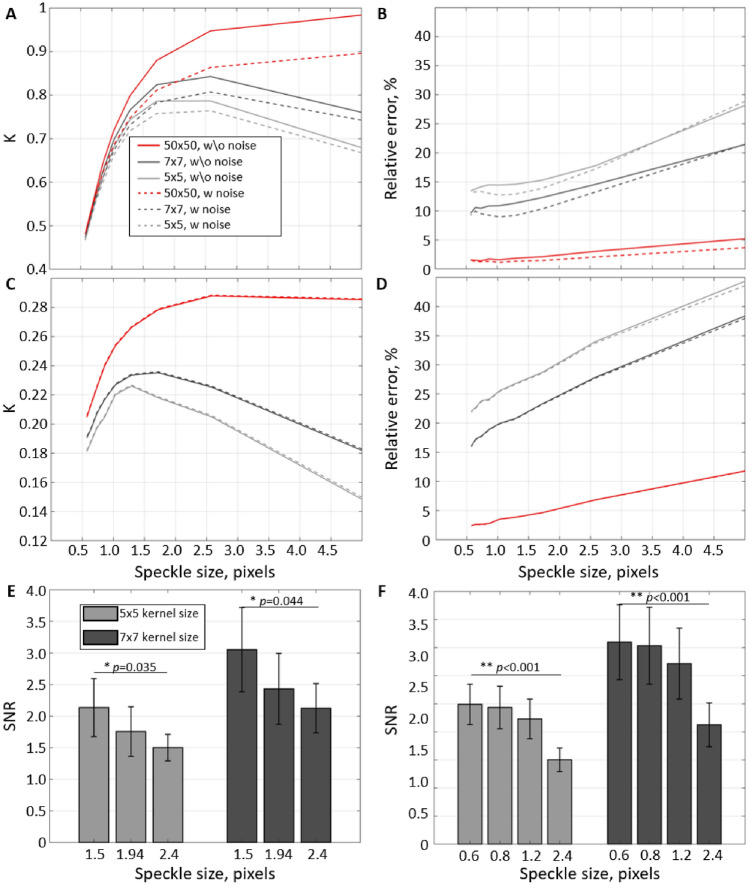
Figure 1.
The principal role of speckle statistics. (A–D) Mean contrast K and the corresponding relative error estimated from the simulation using independent frames with (A,B) and (C,D). Lines colour reflects the pixel’s neighbourhood size used in the contrast calculation. Solid lines correspond to simulations where the error is defined only by speckle statistics, and dashed lines to simulations with the camera-related noise enabled. (E,F) Signal-to-noise ratio (SNR) measured from the experimental data for different speckle to pixel sizes. (E) Speckle size was adjusted physically by closing or opening the iris. (F) Speckle size was changed by numerically binning the pixels in recordings with the original speckle-to-pixel size ratio of 2.4. Both in simulation (B,D) and experimental data (E,F), it is clear that a decrease in the number of speckles per contrast neighbourhood leads to a reduction in the precision of the measurements. At the same time, the effect of camera noise and data discretization (dashed lines B,D) appears negligible compared to the importance of speckle statistics.

