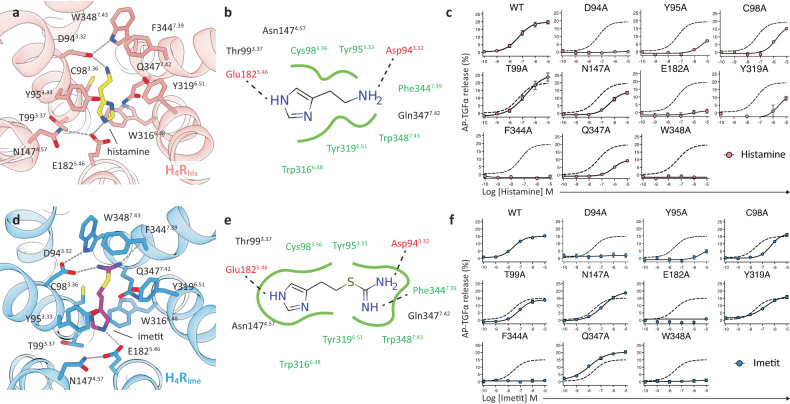
Fig. 2. Agonist recognition of H4R.
a Detailed interactions between histamine and H4R. Histamine and contact residues are shown as yellow and pink sticks. b Schematic representation of histamine-binding interactions. Hydrogen bonds are shown as dashed lines, and hydrophobic interactions and amino acids are shown in green. c Mutant study to assess the histamine response by the TGFα shedding assay. Dashed lines in the mutant graphs represent the wild-type (WT) H4R response. Concentration-response curves are shown as the mean ± standard error of the mean (SEM) from three independent experiments performed in triplicates. In many data points, the error bars are smaller than the symbols and are therefore not visible. d Detailed interactions between imetit and H4R. Imetit and contact residues are shown as magenta and blue sticks. e Schematic representation of imetit-binding interactions. f Mutant study to assess the imetit response by the TGFα shedding assay. Details are the same as in (c).

