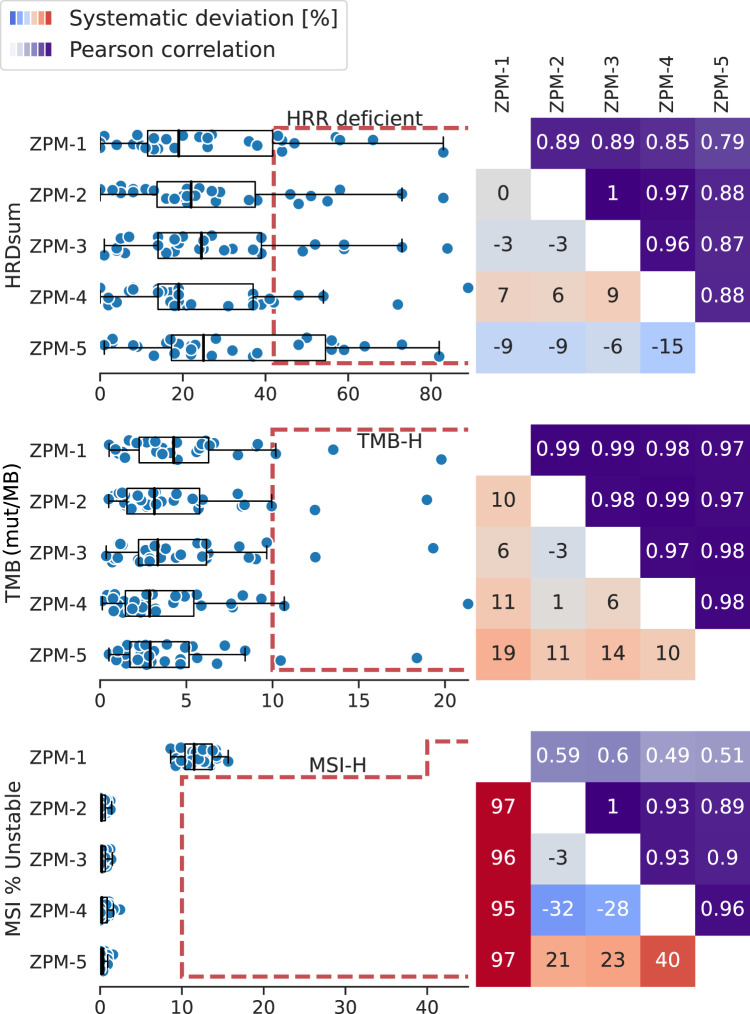
Fig. 5. Inter-institution concordance of HRD, TMB, and MSI scores.
Left: Distribution of the complex biomarkers scores together with the institution-specific cut-off points. Boxplots show the median, quartiles and whiskers up to 1.5 times of the box size. Right: Pearson correlation of the scores between pairs of institutions (upper triangle). Systematic deviation (in %) between two institutions (lower triangle). Red = systematic higher scores. Blue = systematic lower scores.

