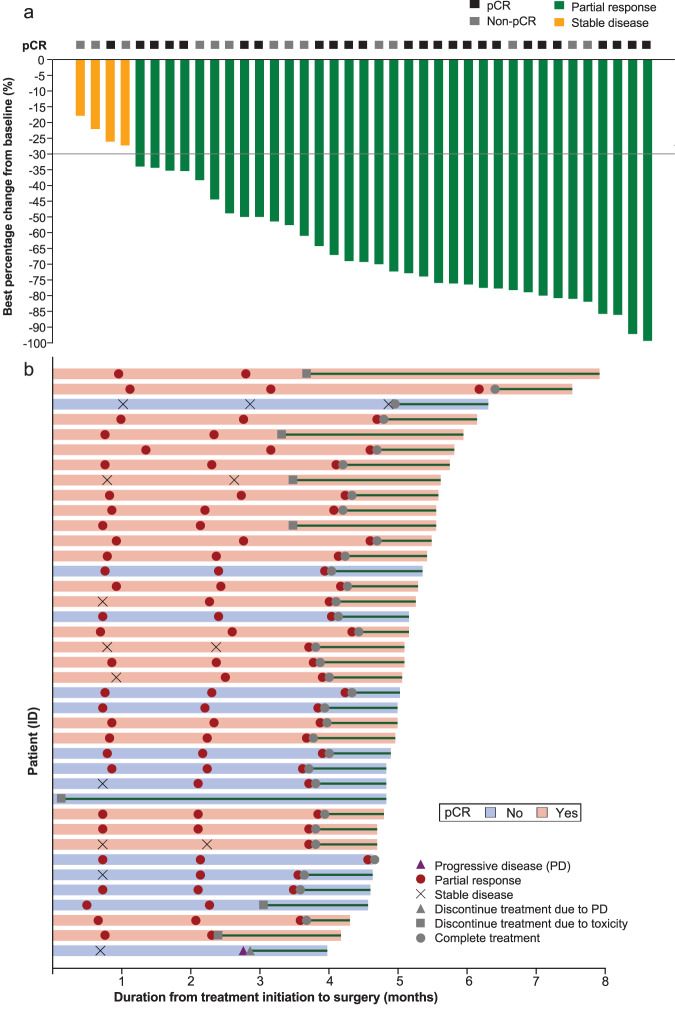
Fig. 2. Clinical and pathological response to neoadjuvant camrelizumab plus chemotherapy in 39 patients with early triple-negative breast cancer.
a The waterfall plot showing the best percentage changes in tumor size of target lesions from baseline. Green bars indicate patients having the best overall response of partial response, and yellow bars indicate those having stable disease. The black boxes above indicate patients achieving a pathological complete response (pCR), while gray boxes indicate those without. The gray horizontal line indicates a 30% decrease from the baseline. b The swimmer plot showing the individual patient’s journey from treatment initiation to surgery. The length of the bar indicates the duration from treatment initiation to surgery, and the colors indicate the pathological tumor response (light pink: pCR, baby blue: non-pCR). Tumor response at each assessment is shown as a red circle (partial response), gray cross (stable disease), or purple triangle (progressive disease). The reason for the end of the treatment is shown as a gray triangle (discontinuation due to disease progression), square (discontinuation due to toxicity), or circle (completion). Green lines indicate the duration from the end of the treatment to surgery. Source data are provided as a Source Data file.

