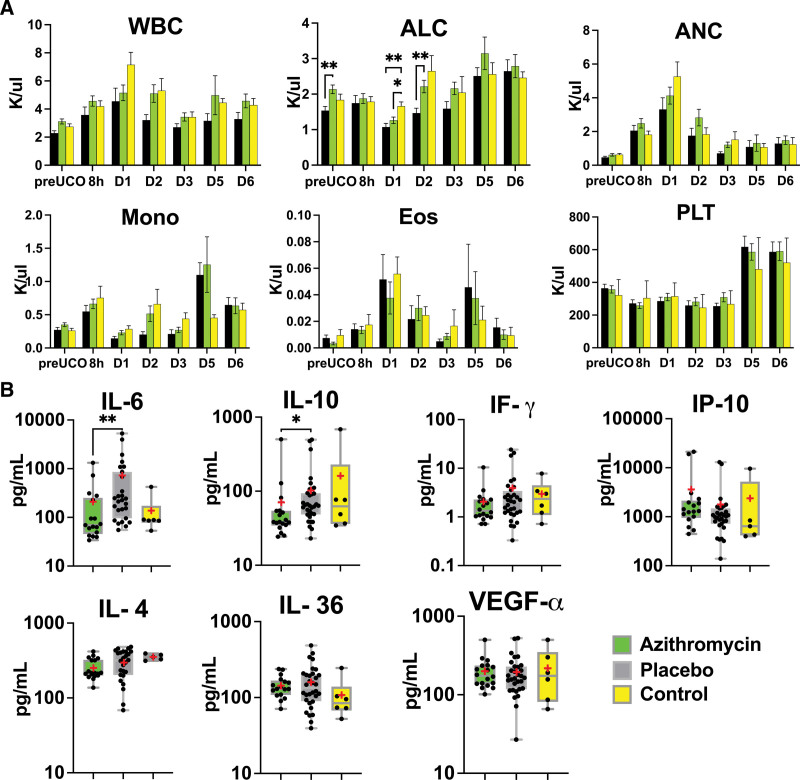
Figure 2.
Peripheral markers of inflammation. A, Absolute lymphocyte count (ALC) differed at baseline and on days 1 and 2 in azithromycin (AZM) vs placebo group. Cellular subgroups were evaluated by mixed-effect analysis with Smidak correction for multiple comparisons. The summary column graphs show means±SEM. AZM: n=8 to 21; placebo: n=7 to 12; control: n=4 to 21 (control data were used with permission from Mike et al23). B, At 6 days after the umbilical cord occlusion (UCO), we noticed changes in IL-6 (interleukin-6) and IL-10 (interleukin-10). No changes were observed in IL-4 (interleukin-4), IF-g (interferon-g), IP-10 (interferon-g inducible protein), IL-36 (interleukin-36), or VEGF-α (vascular endothelial growth factor-α). We used Kruskal-Wallis test. AZM: n=15 to 19; placebo: n=27 to 32; control: n=5 to 6. The box graphs show the mean as red asterisk “*” and the median with interquartile range. AZM-treated group, green. Placebo, black. Controls, yellow. ANC indicates absolute neutrophil count; Eos, eosinophil; Mono, monocyte; PLT, platelet; and WBC, white blood cell. *P<0.05, **P<0.01.

