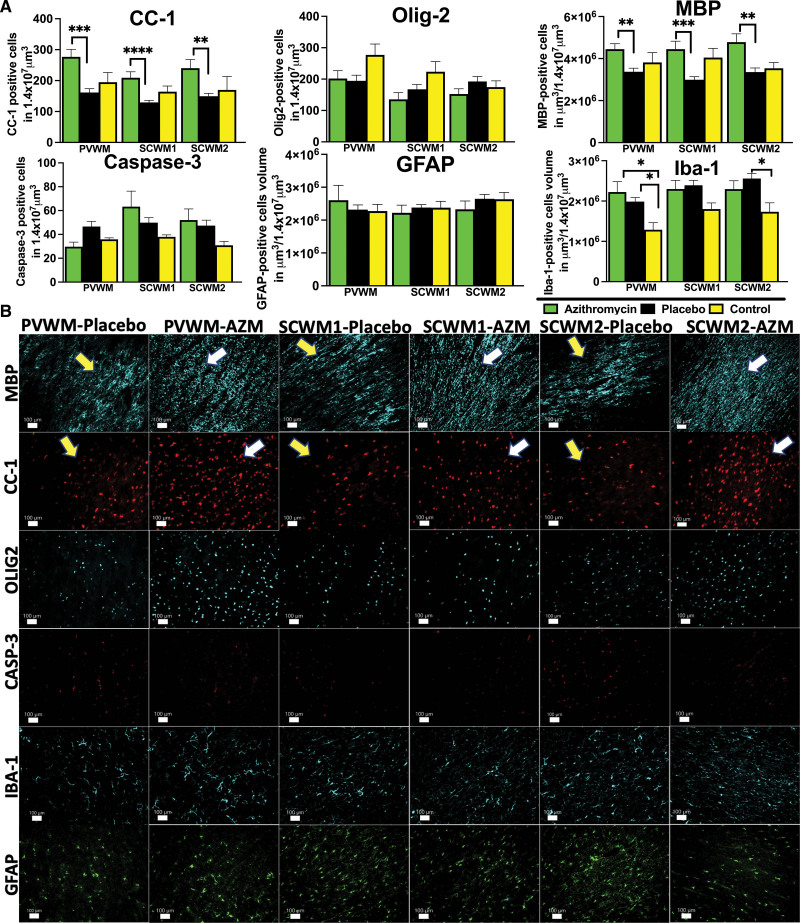
Figure 3.
Quantitative analysis of white matter markers and markers of inflammation. A, The number of antiadenomatous polyposis coli clone CC-1 (CC-1), and the volume of MBP (myelin basic protein)-stained myelin fibers reflect the changes triggered by umbilical cord occlusion in periventricular white matter (PVWM), subcortical white matter of cingulate gyrus (SCWM1), and subcortical white matter of the first parasagittal gyrus (SCWM2) in azithromycin (AZM)-treated (green) vs placebo-treated (black) vs control (yellow) animals. The cellular death was quantified by the number of cleaved Casp-3 (caspase-3)-positive cells. The neuroinflammation was quantified by the total volume of GFAP (glial fibrillary acidic protein)-positive glial and microglial Iba-1-positive cells. Analyzed were AZM: n=7 to 20, placebo: n=6 to 11, and control: n=5 to 9 animals (control data were used with permission from Mike et al23) using either ANOVA or Kruskal-Wallis test. Data are presented as mean±SEM. Brackets show significance as follows: *P<0.05, **P<0.01,***P<0.001, ****P<0.0001. B, The representative photomicrographs of histological changes with preservation of the myelin fibers (MBP) and mature oligodendrocytes (CC-1) in AZM-treated group (MBP), myelin breaks, and loss of CC-1 in the placebo group. Cellular death (Casp-3) and gliosis (GFAP) were unchanged among the groups, and more microglial (Iba-1 [ionized calcium-binding adaptor molecule-1]) accumulation was observed in PVWM in both groups and placebo group in SCWM2. Yellow arrows—placebo histopathology, white arrows—AZM-treated histopathology.

