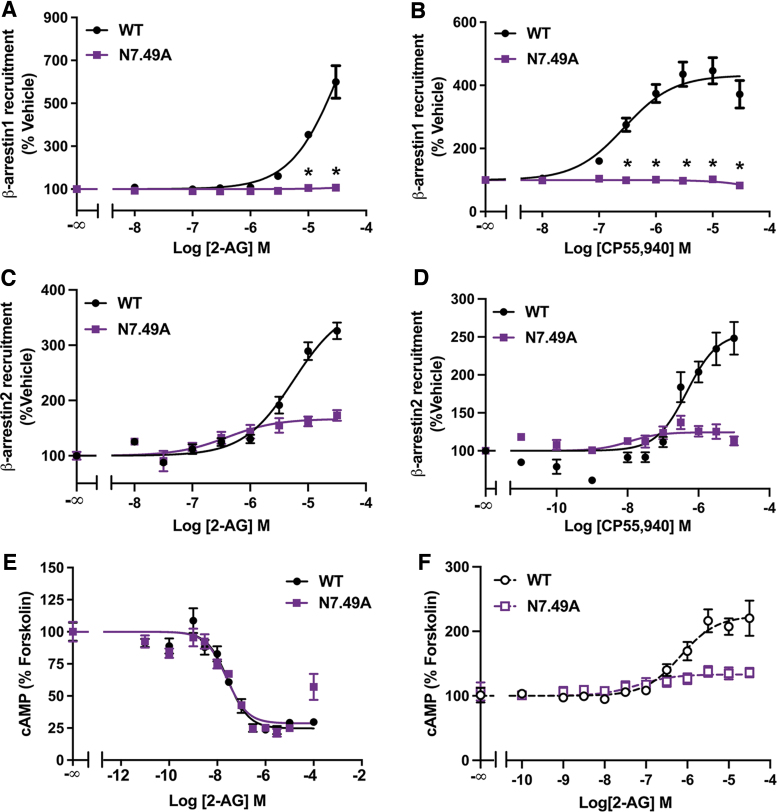
FIG. 1.
N7.49A mutation impairs β-arrestin recruitment. (A) Impaired 2-AG stimulated recruitment of β-arrestin1 by N7.49A analyzed by the β-galactosidase enzyme complementation assay. Data from three biological replicates performed in three technical replicates (N=9) and fit to a three-parameter nonlinear regression curve. Effect at each dose was compared by two-way ANOVA (dose, genotype, and interaction: p<0.0001) followed by Šidák's multiple comparisons test: *p<0.0001. (B) CP55,940 stimulated recruitment of β-arrestin1 by N7.49A assayed by a β-galactosidase enzyme complementation assay. Data from three biological replicates performed in three technical replicates (N=9) and fit to a three-parameter nonlinear regression curve. Effect at each dose compared by two-way ANOVA (p<0.0001) followed by Šidák's multiple comparisons test: *p<0.0001. (C) Reduced β-arrestin2 recruitment in N7.49A. Data from four biological replicates performed in three technical replicates (N=12) and fit to a three-parameter nonlinear regression curve. Parameters compared by Welch's t test: EC50 (14.3-fold shift, p=0.0075) and Emax (55% reduction, p=0.0005). (D) CP55,940 stimulated β-arrestin2 recruitment by S7.57E. Data from four biological replicates performed in three technical replicates (N=12) and fit to a three-parameter nonlinear regression curve. Parameters compared by Welch's t test: EC50 (42.6-fold shift, p=0.025) and Emax (51% reduction, p=0.0011). (E) No change in the inhibition of cAMP accumulation by 2-AG in forskolin-treated cells expressing the WT or N7.49A CB1 receptor. Data from three biological replicates performed in three technical replicates (N=9) and fit to a three-parameter nonlinear regression curve. Parameters compared by Welch's t test: IC50 (p=0.65) and Emax (p=0.34). (F) N7.49A reduced 2-AG-mediated stimulation of cAMP accumulation in cells pretreated with PTx. Data from three biological replicates performed in three technical replicates (N=9) and fit to a three-parameter nonlinear regression curve. Parameters compared by Welch's t test: EC50 (11.1-fold shift, p=0.049) and Emax (73% reduction, p=0.0025). All data shown as mean±SEM. 2-AG, 2-arachidonoylglycerol; ANOVA, analysis of variance; PTx, pertussis toxin; SEM, standard error of the mean; WT, wild type.

