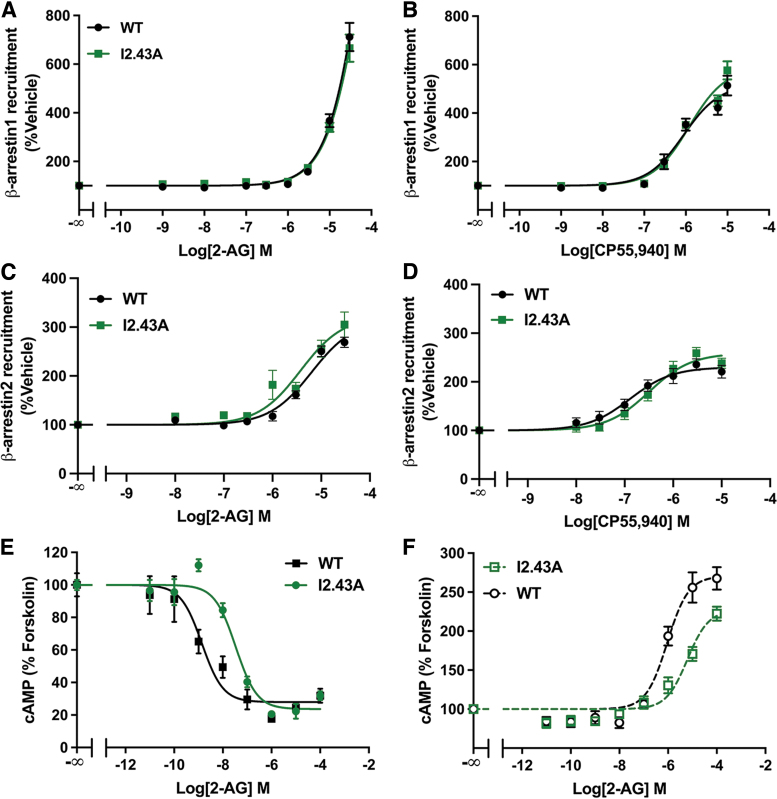
FIG. 3.
I2.43A mutation inhibited G-protein signaling. (A) 2-AG stimulated recruitment of β-arrestin1 assayed by a β-galactosidase enzyme complementation assay. Data from three biological replicates performed in three technical replicates (N=9) and fit to a three-parameter nonlinear regression curve. Effects of 2-AG doses were compared by two-way ANOVA (treatment: p<0.0001; genotype: p=0.99; interaction: p=0.85). (B) CP55,940 stimulated β-arrestin1 recruitment assayed by a β-galactosidase enzyme complementation assay. Data from three biological replicates performed in three technical replicates (N=9) and fit to a three-parameter nonlinear regression analysis. Parameters were compared by Welch's t test: EC50 (p=0.30) and Emax (p=0.056). (C) 2-AG stimulated recruitment of β-arrestin2. Data from four biological replicates performed in three technical replicates (N=12) and fit to a three-parameter nonlinear regression curve. Parameters compared by Welch's t test: EC50 (p=0.82) and Emax (p=0.25). (D) No effect of I2.43A on CP55,940-stimulated β-arrestin2 recruitment. Data from four biological replicates performed in three technical replicates (N=12) and fit to a three-parameter nonlinear regression curve. Parameters compared by Welch's t test: EC50 (p=0.060) or Emax (p=0.058). (E) Reduced potency but not efficacy (IC50: 24.7-fold increase, p=0.0041; Emax: p=0.40) of 2-AG for the inhibition of cAMP accumulation in forskolin-treated cells expressing WT or I2.43A CB1 receptor. Data from three biological replicates performed in three technical replicates (N=9) and fit to a three-parameter nonlinear regression curve. (F) I2.43A reduced 2-AG-mediated stimulation of cAMP accumulation in cells pretreated with PTx. Data from three biological replicates performed in three technical replicates (N=9) and fit to a three-parameter nonlinear regression curve. Parameters compared by Welch's t test: EC50 (6.7-fold increase, p=0.0003) and Emax (16% reduction, p=0.0038). All data are shown as mean±SEM.

