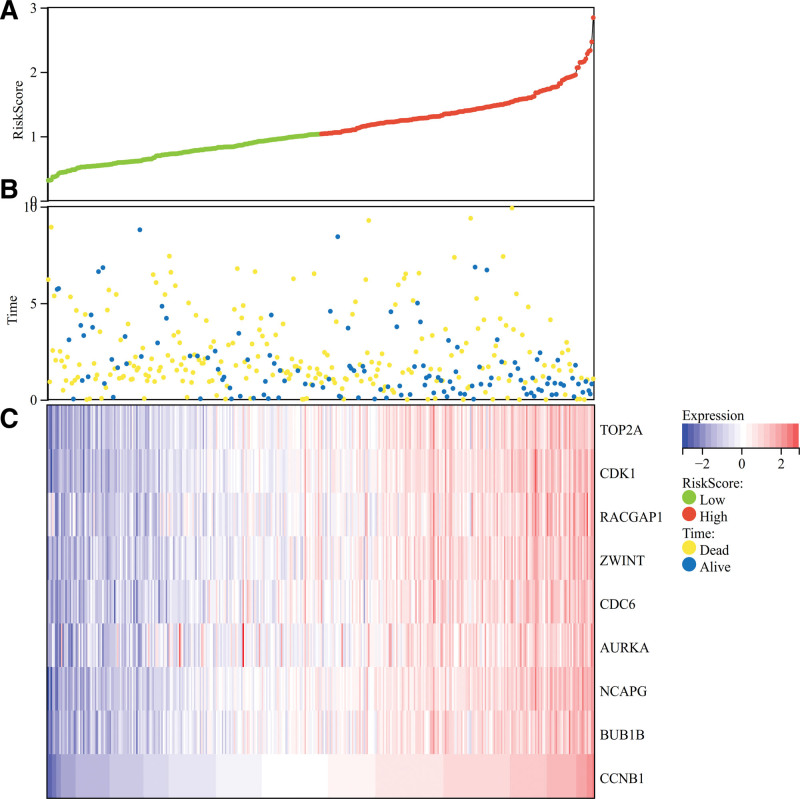
Figure 8.
Prognostic score relationship and gene expression thermograph. The heat map of the expression of core genes in the samples. (A and B) The survival time and survival rate in the normal tissue were significantly higher than those in the hepatocellular carcinoma (C) 10 core genes (TOP2A, CDK1, ASPM, RACGAP1, ZWINT, CDC6, AURKA, NCAPG, BUB1B, CCNB1) and found that these core genes were highly expressed in tumor tissues and low in normal tissues.

