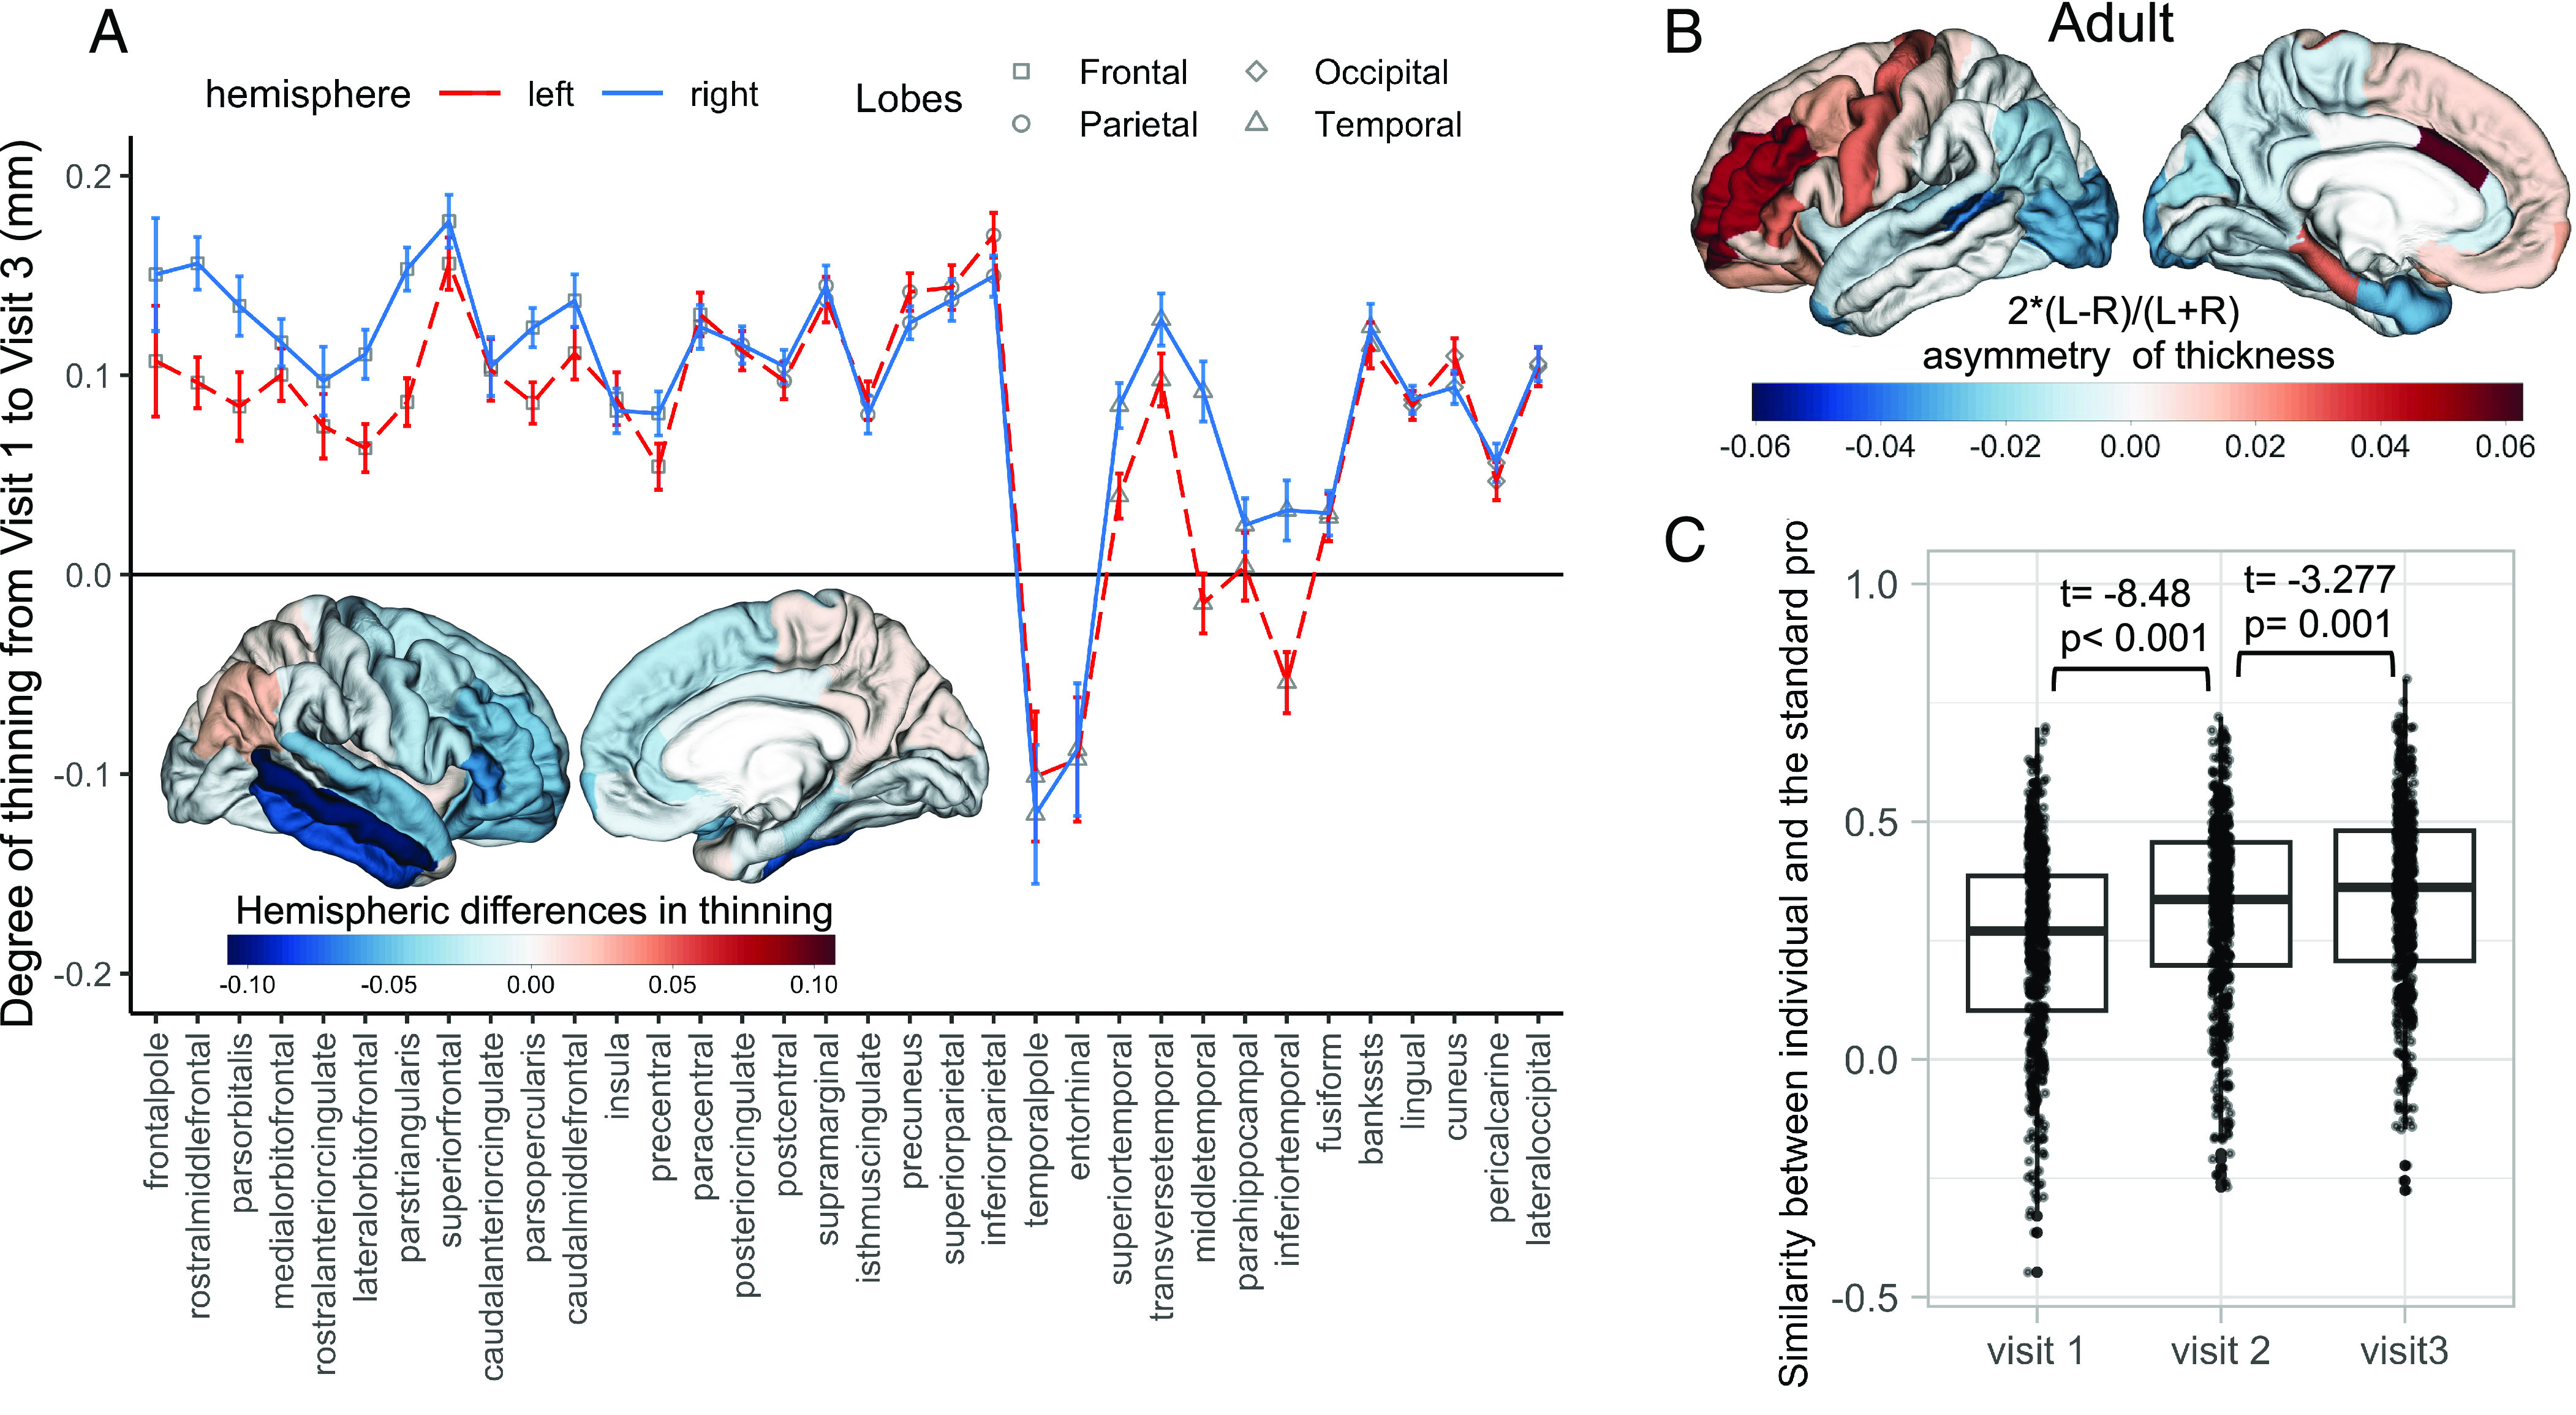
Fig. 1.

Hemispheric differences in cortical thinning and the maturation of thickness asymmetry. (A) The degree of cortical thinning (higher values, more thinning) from visit 1 to visit 3 in the left and the right hemispheres (plot), and the map of hemispheric differences in thinning (Left Bottom). The error bars in Fig. 1A represent the 95% CI of cortical thinning within each region. In the brain map, negative values (in blue) of hemispheric differences in thinning indicate more thinning in the right than the left hemisphere. (B) The adult profile of thickness asymmetry was derived from 231 young adults, positive values (in red) indicate the left hemisphere is thicker than the right. (C) From adolescence to adulthood, individual profiles of thickness asymmetry became more similar to the adult profile.
