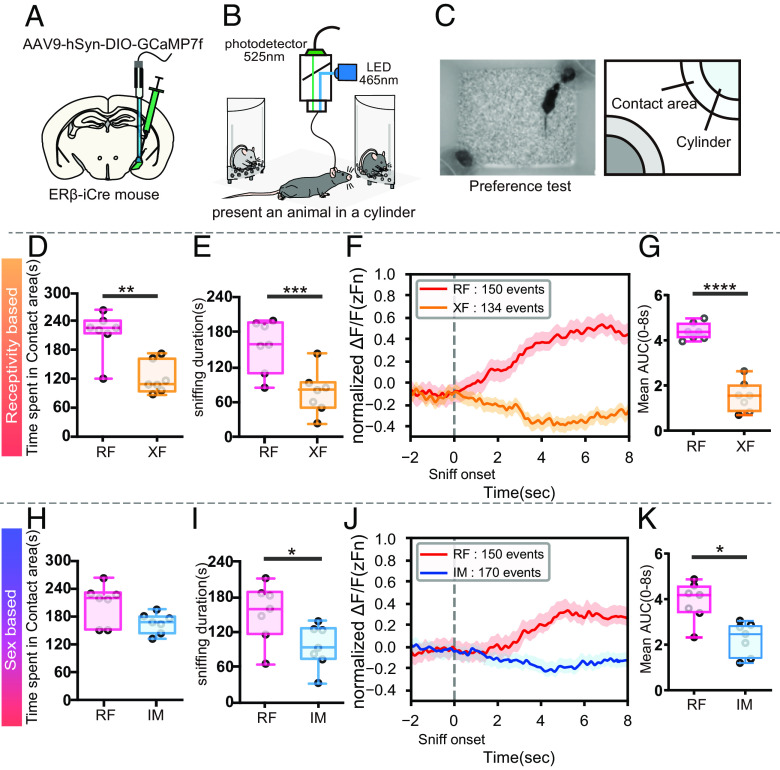
Fig. 1.
Fiber photometry recordings from MeApd-ERβ+ neurons during the sexual preference test. (A) A schematic diagram showing the AAV injection and fiber implantation in the MeApd. (B) A schematic diagram of the fiber-photometry system (465 nm LED emission light, filter 525 nm). (C) Representative photograph (Left) and schematic diagram of the preference test setup (Right). (D) Duration of time spent in each contact area (seconds) during RF (red) vs. XF (orange) preference tests (Mean ± SEM, n = 7, **P < 0.01). (E) Sniffing duration toward each stimulus (seconds) during RF (red) vs. XF (orange) preference tests (Mean ± SEM, n = 7, ***P < 0.001). (F) The mean GCaMP7f signals (zFn) during sniffing toward RF (red: 150 events) and XF (orange: 134 events) stimulus mice. The data were derived from seven male mice and shown for 10 s (2 s before to 8 s after) around the onset of each sniffing event. (G) Mean AUC during 8 s of sniffing behavior, delivered from the positive area of normalized GCaMP7f signals (0 < zFn) in RF (red) vs. XF (orange) preference tests (Mean ± SEM, n = 7, ****P < 0.0001). (H) Duration of time spent in each contact area (seconds) during RF (red) vs. IM (blue) preference tests (Mean ± SEM, n = 7). (I) Sniffing duration toward each stimulus (seconds) during RF (red) vs. IM (blue) preference tests (Mean ± SEM, n = 7, *P < 0.05). (J) The mean GCaMP7f signals (zFn) during sniffing toward RF (red: 150 events) and IM (blue: 170 events) stimulus mice. The data were derived from seven male mice and shown for 10 s (2 s before to 8 s after) around the onset of each sniffing event. (K) Mean AUC during 8 s of sniffing behavior, delivered from the positive area of normalized GCaMP7f signals (0 < zFn) in RF (red) vs. IM (blue) preference tests (Mean ± SEM, *P < 0.05). AAV, adeno-associated virus; LED, light-emitting diode; MeA, medial amygdala; MeApd, MeA-posterodorsal; ER, estrogen receptor; RF, receptive female; XF, nonreceptive female; IM, intact male; SEM, standard error of the mean.

