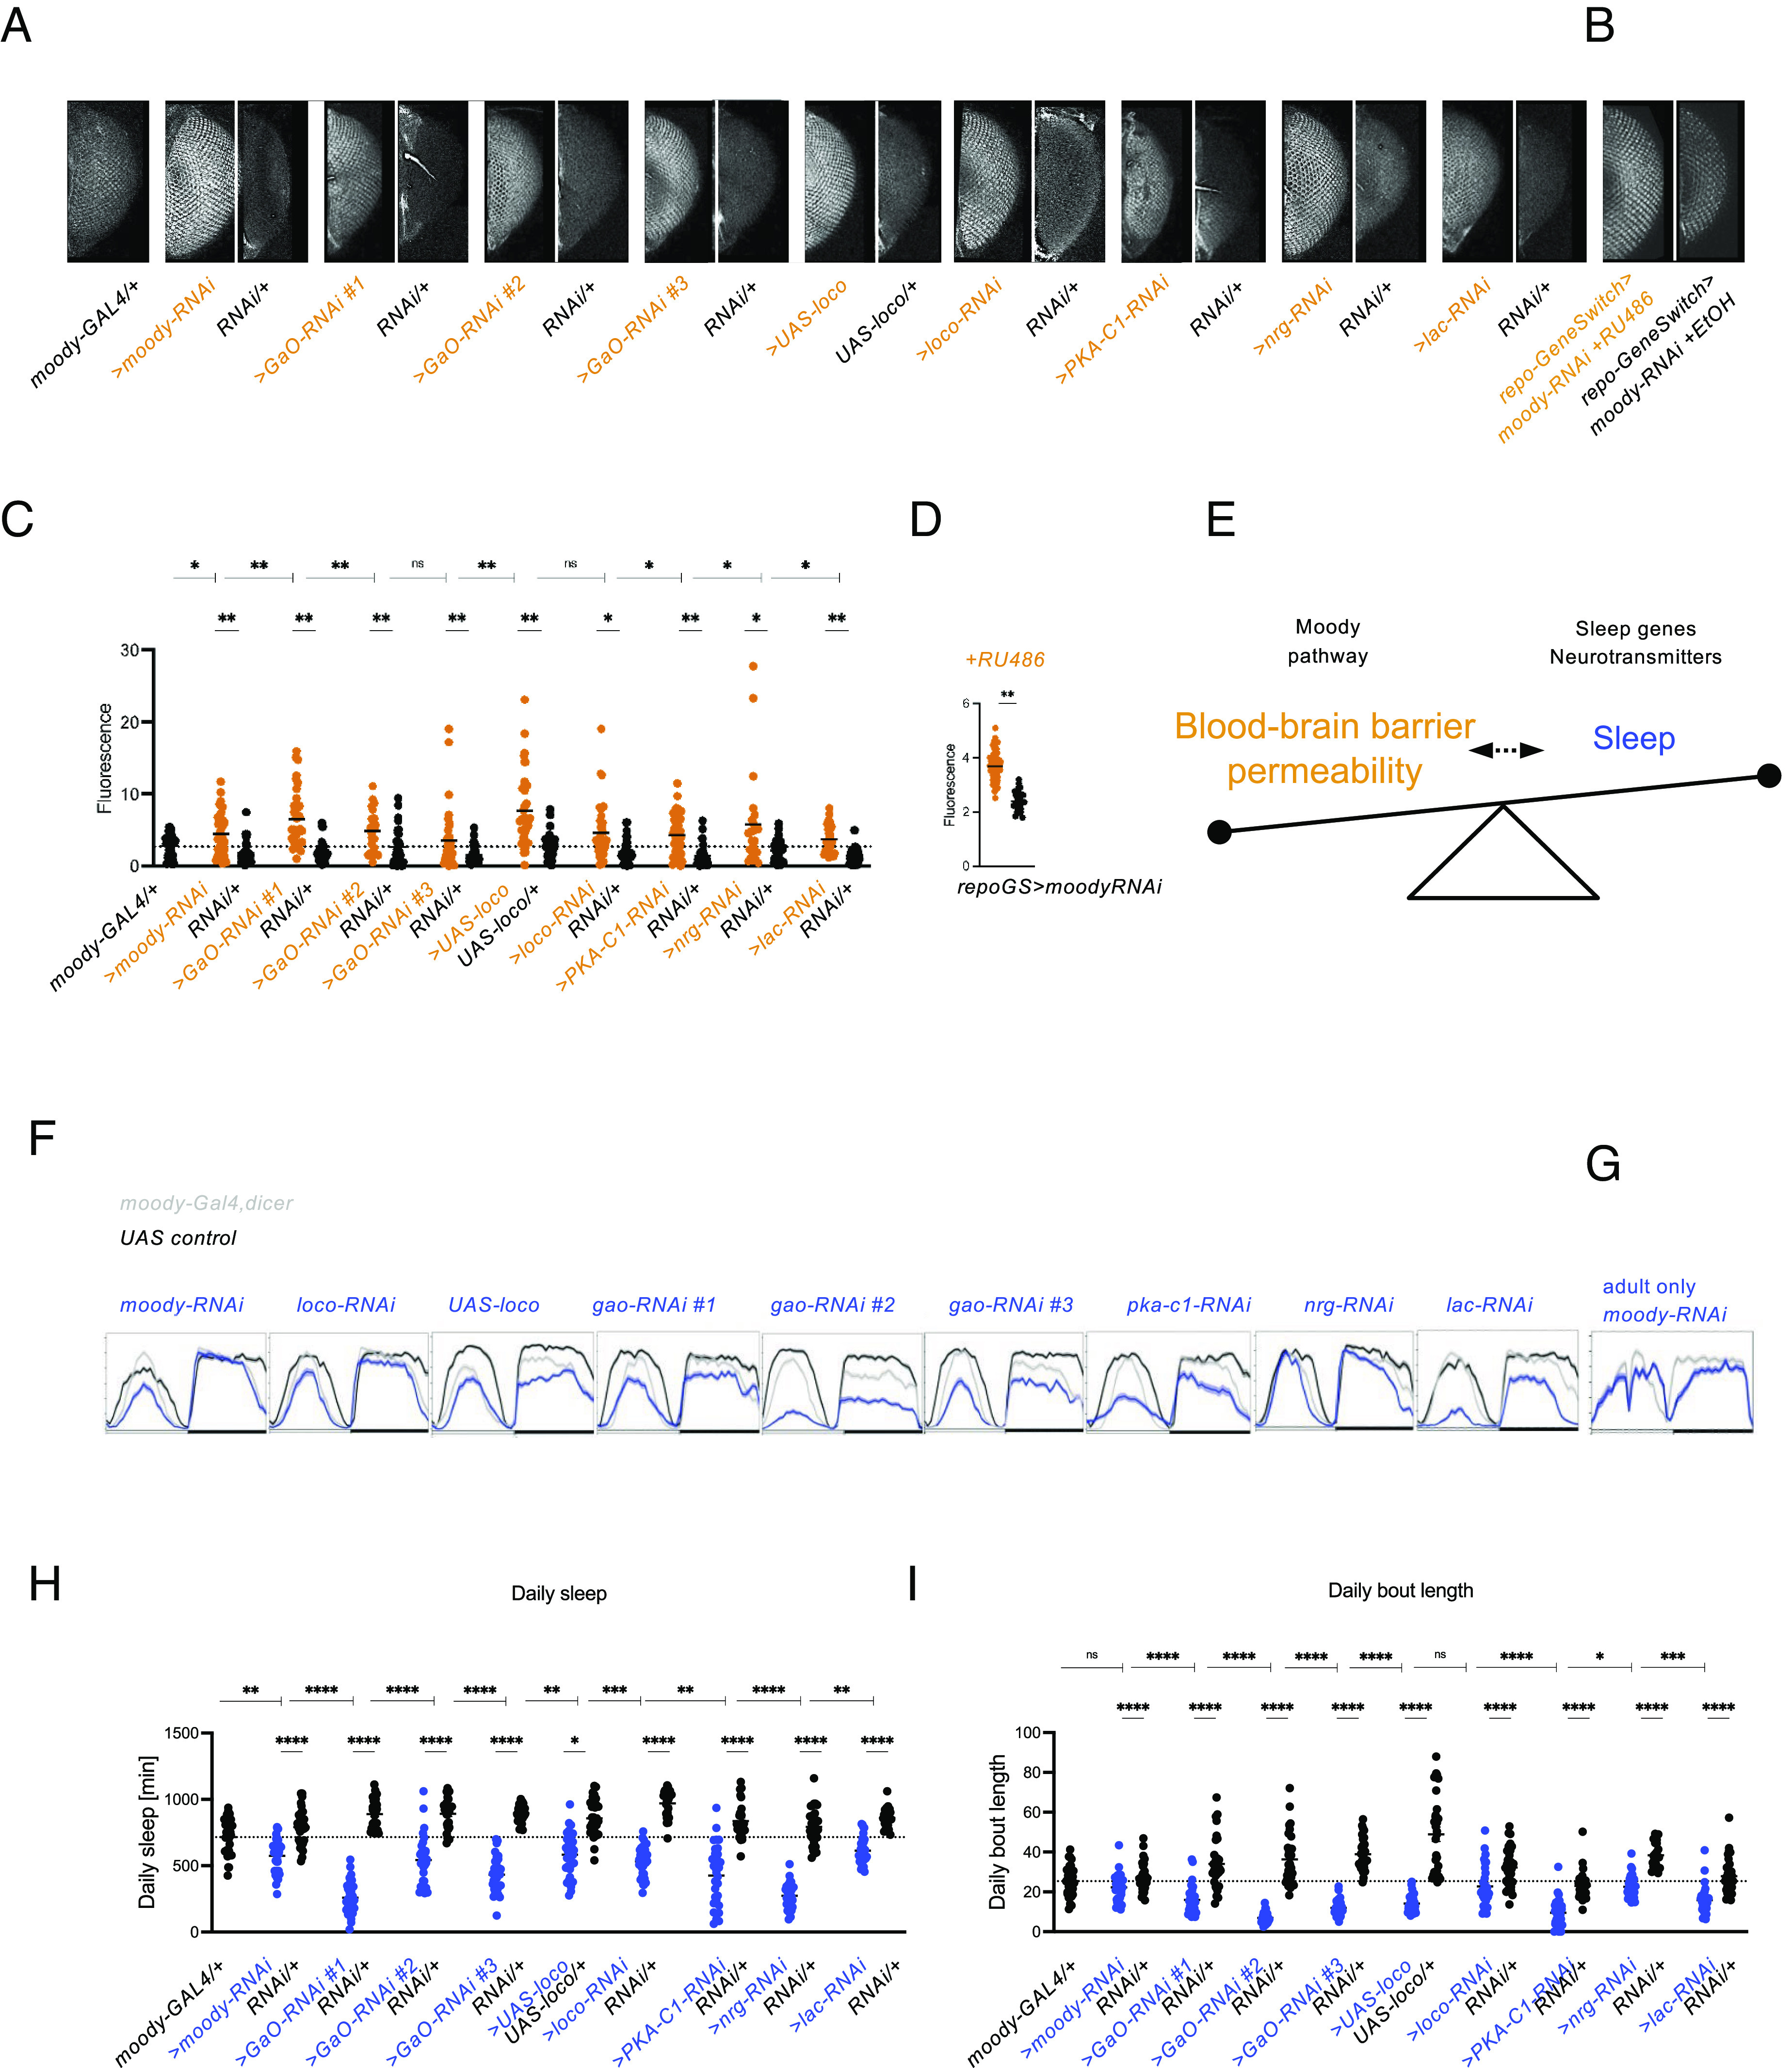
Fig. 4.

Glial GPCR signaling is required for BBB integrity and sleep. (A) Tracer injection assay for SPG-specific RNAi using moody-Gal4 driving moody, GaO, loco, PKA-C1, lachesin, and neuroglian, and driving overexpression of loco, shows increased BBB permeability. (B) Tracer injection assay for adult glia-specific knockdown of the GPCR Moody using repo-GeneSwitch shows increased BBB permeability. (C and D) Quantification of BBB data shown in (A and B). n = 40 - 45. Significance was assessed using one-way ANOVA and post hoc Tukey test (C) and t-testing (D). (E) Model of bidirectiontal relationship between the BBB and sleep. The BBB seems to sense sleep states and respond to SD by increasing permeability and to sleep increases with BBB closure. As opening the BBB itself causes SD, it seems that a particular level of opening, or even its dynamics, signal sleep states. Future work ideally measuring BBB changes and yet to be identified real time sleep biomarkers concomitantly will hopefully elucidate the interplay of BBB dynamics and sleep, but for now, we believe our data suggest that the BBB is at least part of sleep regulation. The moody pathway, neurotransmitters such as dopamine and octopamine as well as sleep genes are known to contribute to the function of the BBB and sleep, respectively, and we observe that modifying them changes the balance between BBB and sleep. (F) BBB-specific knockdown using moody-Gal4 of moody, GaO, loco, PKA-C1, lachesin, and neuroglian and overexpression of loco shows decreased sleep. n = 32. (G) Adult glia-specific knockdown of the GPCR Moody using repo-GeneSwitch leads to decreased sleep. n = 16. (H) Quantification of daily sleep for data shown in (F). Significance was assessed using one-way ANOVA and post hoc Tukey test. (I) Daily bout length quantification for data shown in (F). For quantification of BBB permeability, fluorescence was measured for both eyes of each fly. Each dot represents normalized fluorescence in one eye. For all sleep plots, average 24 h sleep over 4 d binned as sleep in 30 min is shown. Significance levels are P < 0.05: *, <0.01: **, <0.001: ***, <0.0001: ****. For C, H, I, horizontal dashed line indicates mean of moody-Gal4/+ control, and —| indicates comparison to moody-GAL4/+, SPG: subperineurial glia.
