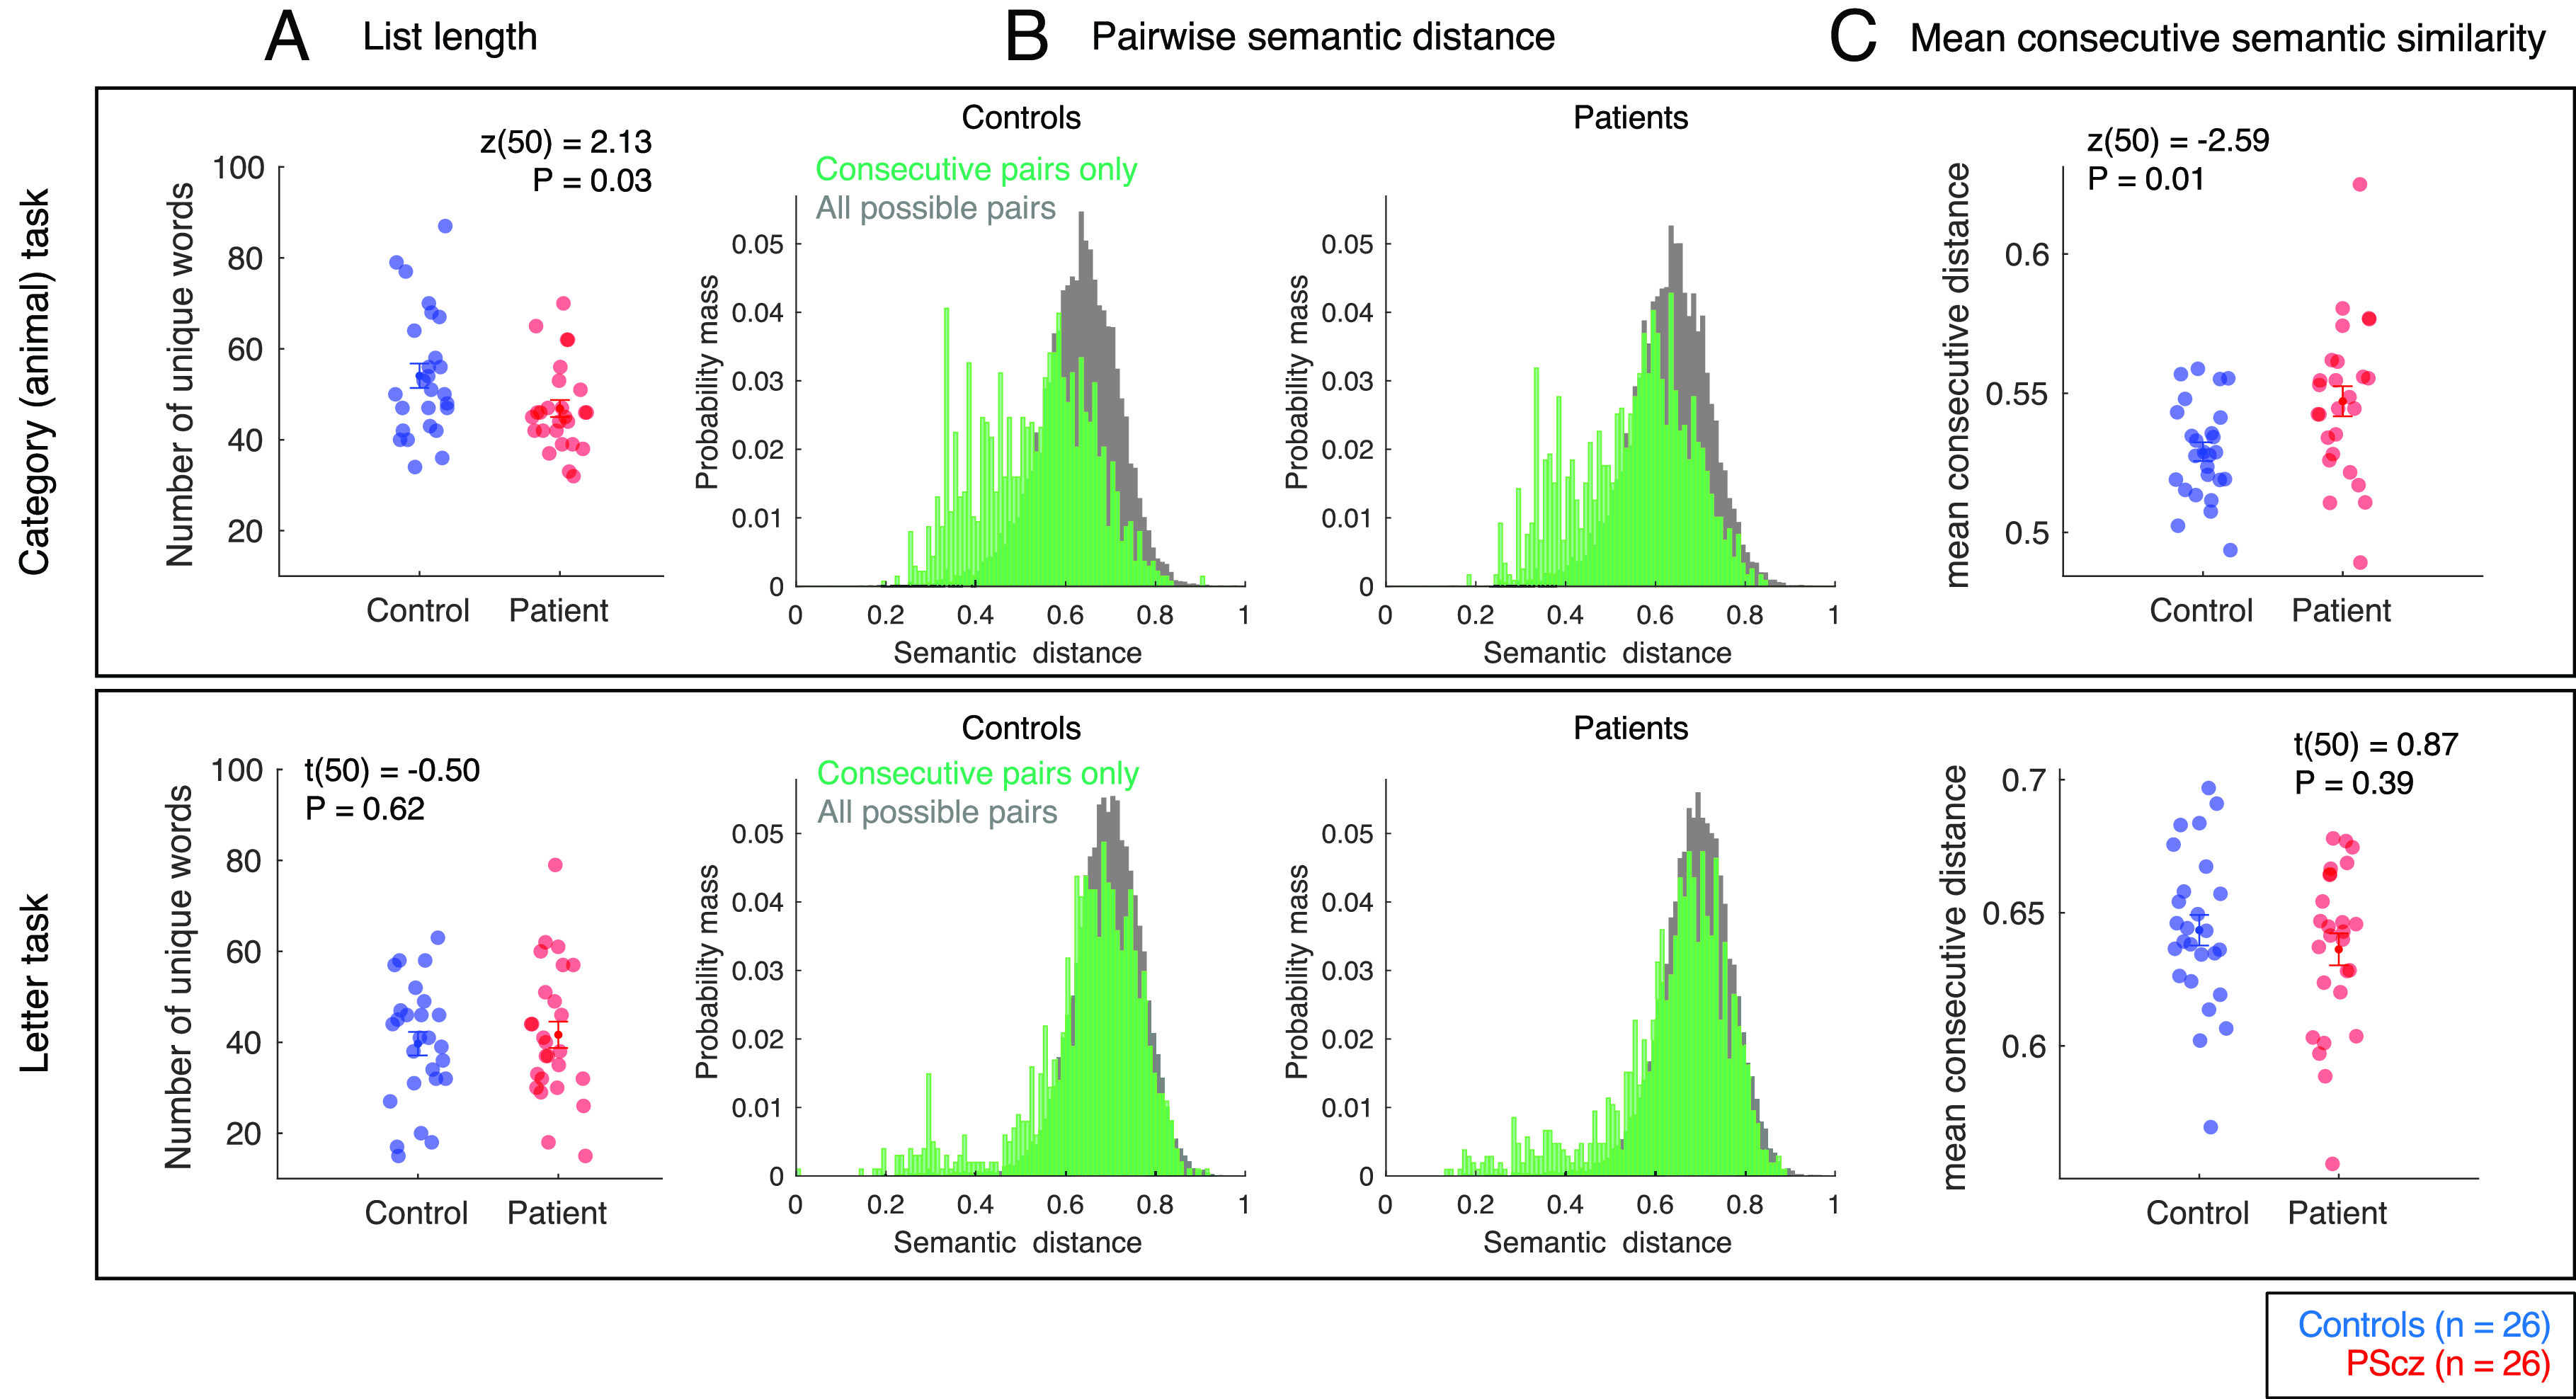
Fig. 2.

Category (“animal”) and letter (“p” words) tasks: list length and pairwise semantic distances. (A) Mean ± SEM number of unique valid words generated in 5 min. See SI Appendix for further results. (B) Distribution of semantic distances for consecutively emitted word pairs (green) vs. distances between all unique words (gray). Distribution corresponds to concatenated lists over all control participants (Left) and PScz (Right). See SI Appendix for further results. (C) Mean ± SEM semantic distance between consecutive words (unique words only). Sample: n = 26 controls, n = 26 PScz. Top: category fluency. Bottom: letter fluency. Group comparison statistics from two sample t tests (t) and Wilcoxon rank sum tests (z), two-tailed.
