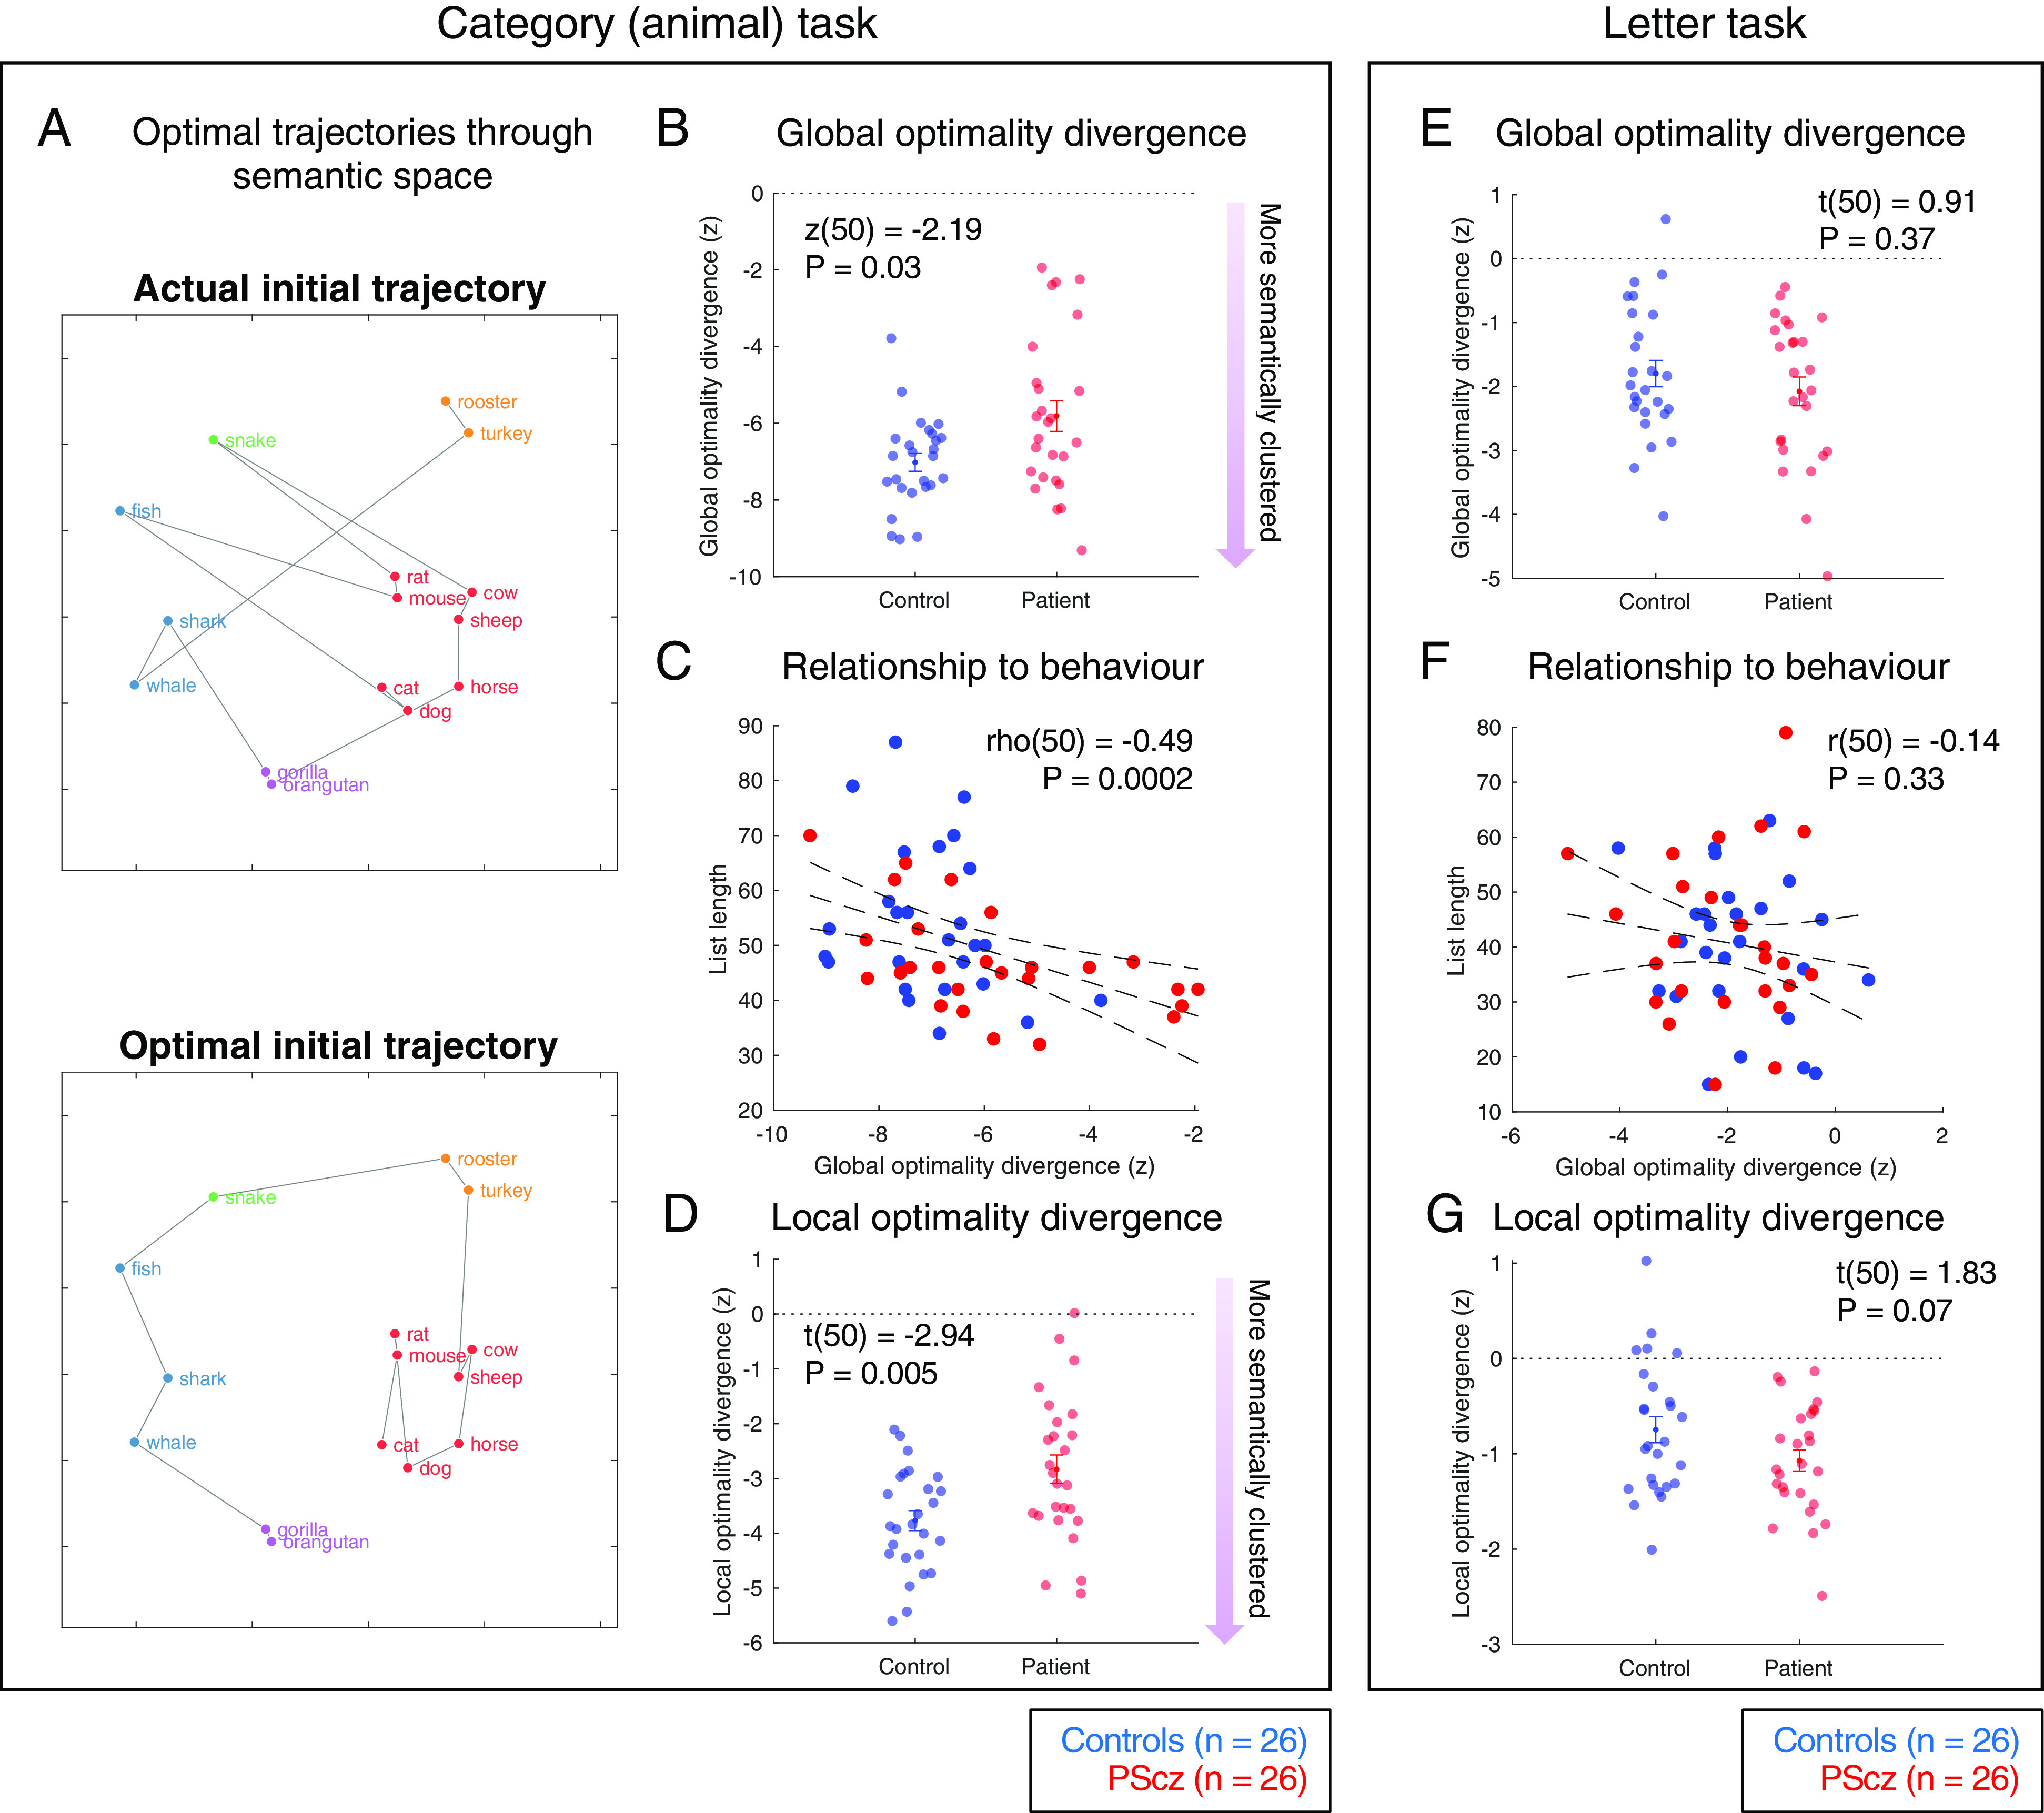
Fig. 3.

Semantic path optimality analysis. (A). First 15 words in the observed (Top) and optimal (Bottom) semantic search path of one example PScz (first word: “cat”). Optimal paths denote the shortest Hamiltonian path in original embedding space. 2-dimensional UMAP visualization (41) using cosine distance in ambient space, intended for illustration purposes only (i.e., optimal paths defined using cosine distance in ambient 300 dimensional word embedding space). Item color from data-driven community assignment (Fig. 4). (B) Global optimality divergence (distanceobserved-distanceoptimal) expressed as a z-score against participant-specific list shuffles (negative values indicate increasing deviation from a random word selection process, i.e., more semantically clustered behavior). (C) Global optimality divergence (in B) predicts task performance (number of items emitted). Spearman’s correlation, two-tailed. (D) Local optimality divergence, quantifying the degree to which observed and optimal paths align at the level of item-item transitions (edges). For a given item list, we assigned every consecutive item–item transition in the observed path a score, corresponding to the number of edges separating the relevant item pair in the optimal path. Local optimality divergence is the sum of these scores across all consecutive item pairs in the observed path, expressed as a z-score as in (B). (E) As (B) but using data from the letter task. (F) As (C) but using data from the letter task. Pearson’s correlation, two-tailed. (G) As (D) but using data from the letter task. Group comparisons (B, D, E and G) expressed as mean ± SEM. Group comparison statistics from two sample t tests (t) and Wilcoxon rank sum tests (z), two-tailed. Error bars on linear trend lines (C and F) reflect 95% CI of the linear regression slope. Length of sliding analysis window (SI Appendix) equals the task-specific minimum list length across all participants [for category task = 32, for letter task = 15 (for similar results with window length = 32 in letter task, see SI Appendix, Fig. S2)]. Sample: n = 26 controls, n = 26 PScz.
