
Fig. 4.
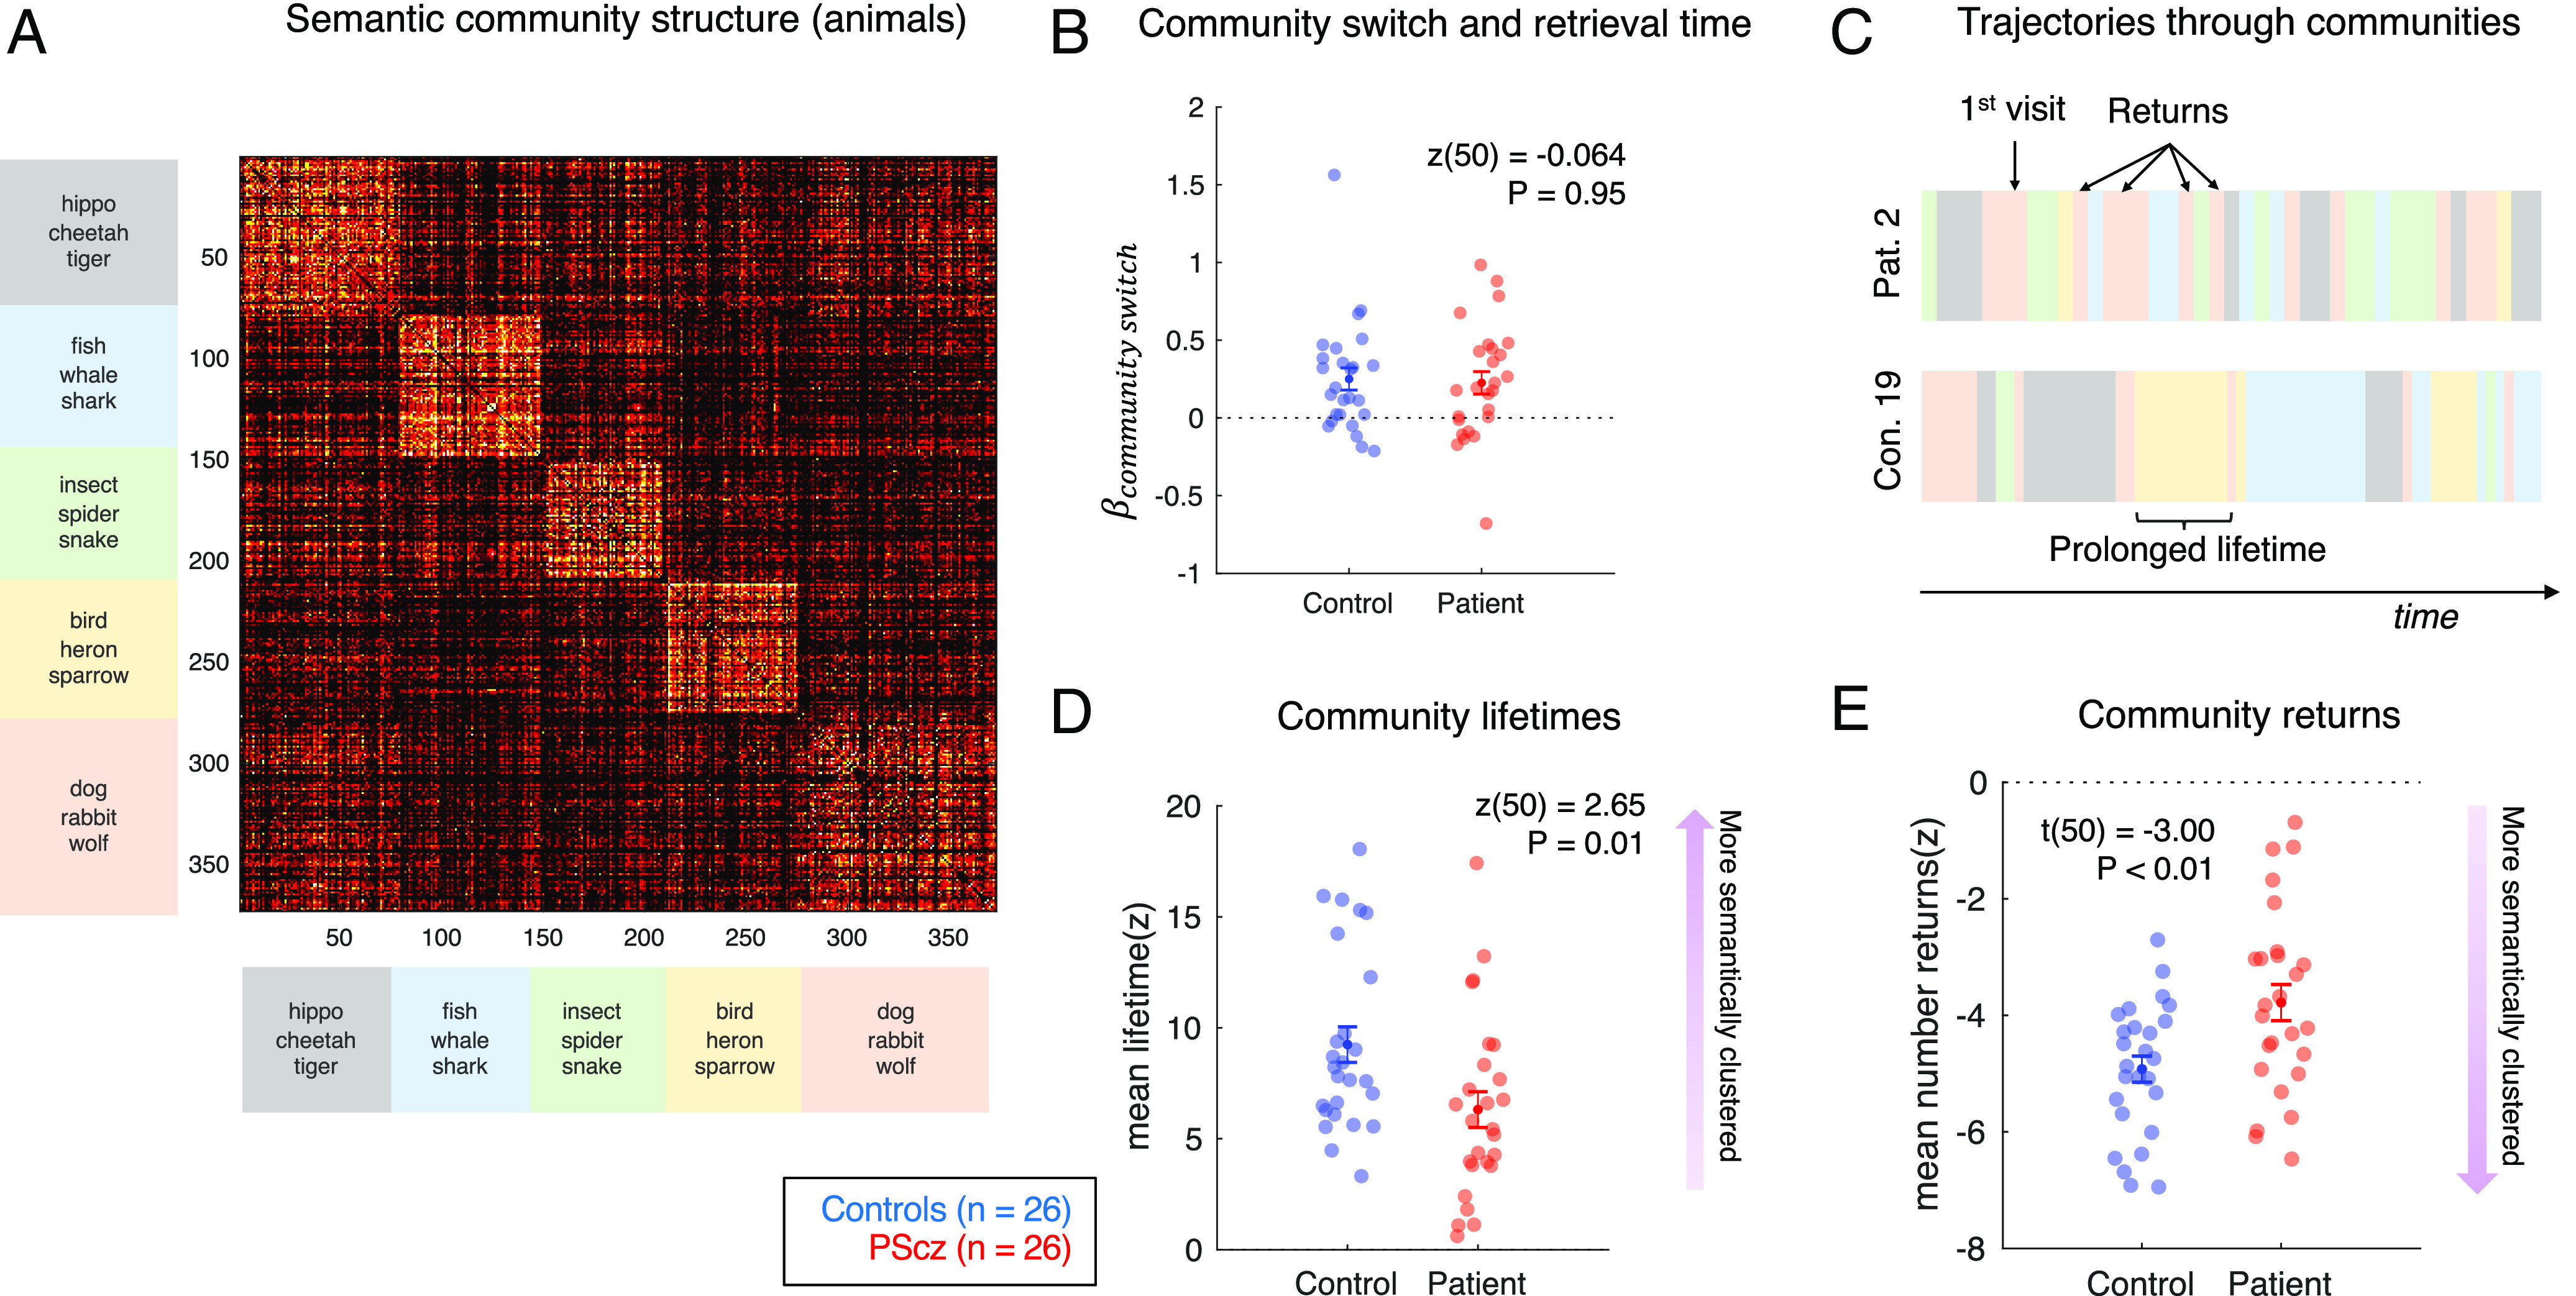
Trajectories through semantic communities in category task. (A) Semantic similarity (1-cosine distance) matrix of all unique response items, ordered by community assignment from Louvain agglomerative clustering algorithm (45). Communities labeled with the first three animal words exhibiting the highest cosine similarity to the cluster center of mass in the fastText vocabulary. Color axis 0.3 to 0.6. (B) For each participant, we regressed (log) retrieval time for each item (RT, duration between consecutive items) onto a design matrix comprising 1) pairwise semantic distance between current item and previous item (demeaned), 2) presence of a “community switch” [binary variable, as defined by community partition in (A)], 3) item response number (as proportion of list length), and 4) a constant term. Figure shows mean ± SEM of the regression coefficient associated with community switches, showing a significant effect greater than 0 in both controls and PScz (i.e., RT slowing with community switch), with no significant group difference (Wilcoxon rank sum test, two-tailed). (C) Two participant trajectories, where items are color coded according to community membership in (A) illustrating key “community trajectory” features. (D) Community “lifetimes” (mean ± SEM number of consecutive words that belong to the same community in a given item list). (E) Community “returns” (mean ± SEM number of times a participant’s item list revisits a semantic community after exiting it for the first time). Effects in (D) and (E) expressed as a z-score with respect to participant-specific null distribution of effects from shuffled lists, and averaged over all consecutive sliding analysis windows, as in item-level trajectory analysis. Group comparison statistics from two sample t tests (t) and Wilcoxon rank sum tests (z), two-tailed. Sample: controls n = 26, PScz n = 26. Community partition performed using the Louvain algorithm (45) with resolution parameter set to 1 (see SI Appendix, Fig. S5 for details and resolution parameter sensitivity analysis).