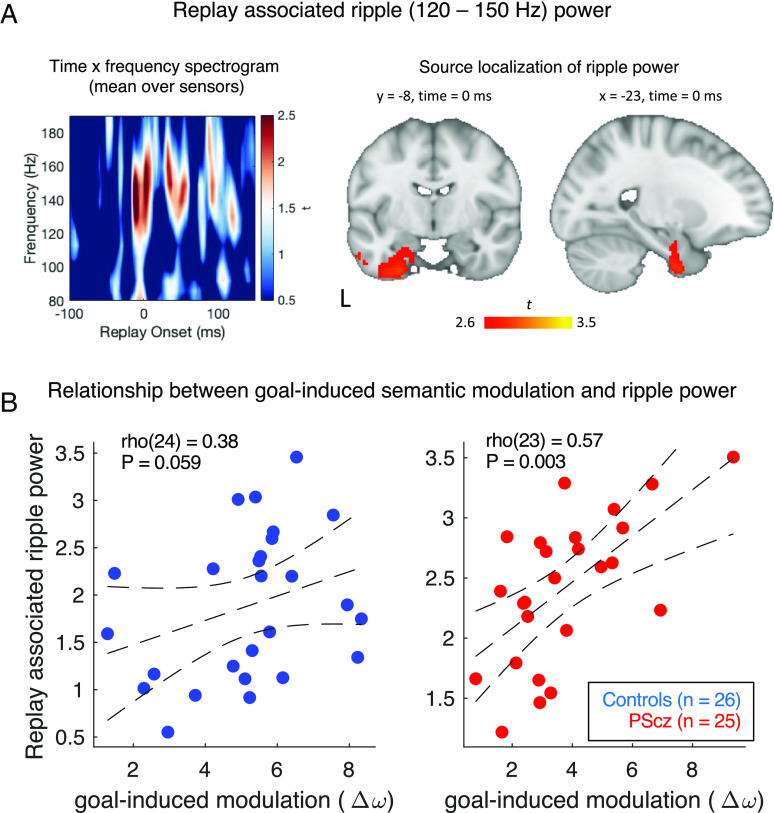
Fig. 6.
Relationship to replay associated ripple power. (A) Ripple power at replay onset. Left: In our previous MEG study in the same sample, we detected a transient increase of high frequency (ripple) power at time points displaying high evidence for spontaneous neural replay of a previously learned task structure, in MEG data from a post-task rest session (see SI Appendix and ref. 11). Spectrogram shows mean power change following onset of putative replay events (0 ms, see SI Appendix) (mean over all replay events and sensors), where power is normalized to a pre-onset baseline (−100 to −10 ms) for each frequency band (as in ref. 11). T-values at each time × frequency combination derived from two-tailed one-sample t test over all participants (n = 51). Right: Source localization of ripple power increases at time of putative replay onset (0 ms in spectrogram) using a beamforming analysis limited to 120 to 150 Hz power band. Ripple power at replay onset was source localized to HEC (significant cluster at PFWE < 0.05, whole-brain level, cluster-based permutation test, 5,000 permutations). Figure shows the statistical parametric map for a group level analysis, displaying the voxel-wise evidence (t-value) that ripple power at replay onset (0 ms) originates from each intracranial source (see SI Appendix for further details). (B) Across participants replay-associated ripple power relates to a behavioral signature of goal-induced semantic modulation ( ). [Replay-associated ripple power defined as peak power increase within the ripple-band from 0 to 50 ms (±10 ms) immediately following replay onset, as in ref. 11]. Spearman’s correlation, two-tailed. Trend lines depict 95% CI of line of best fit. This relationship is also significant in the combined sample of PScz and controls (Results). All results restricted to n = 51 participants who completed both verbal fluency and MEG.

