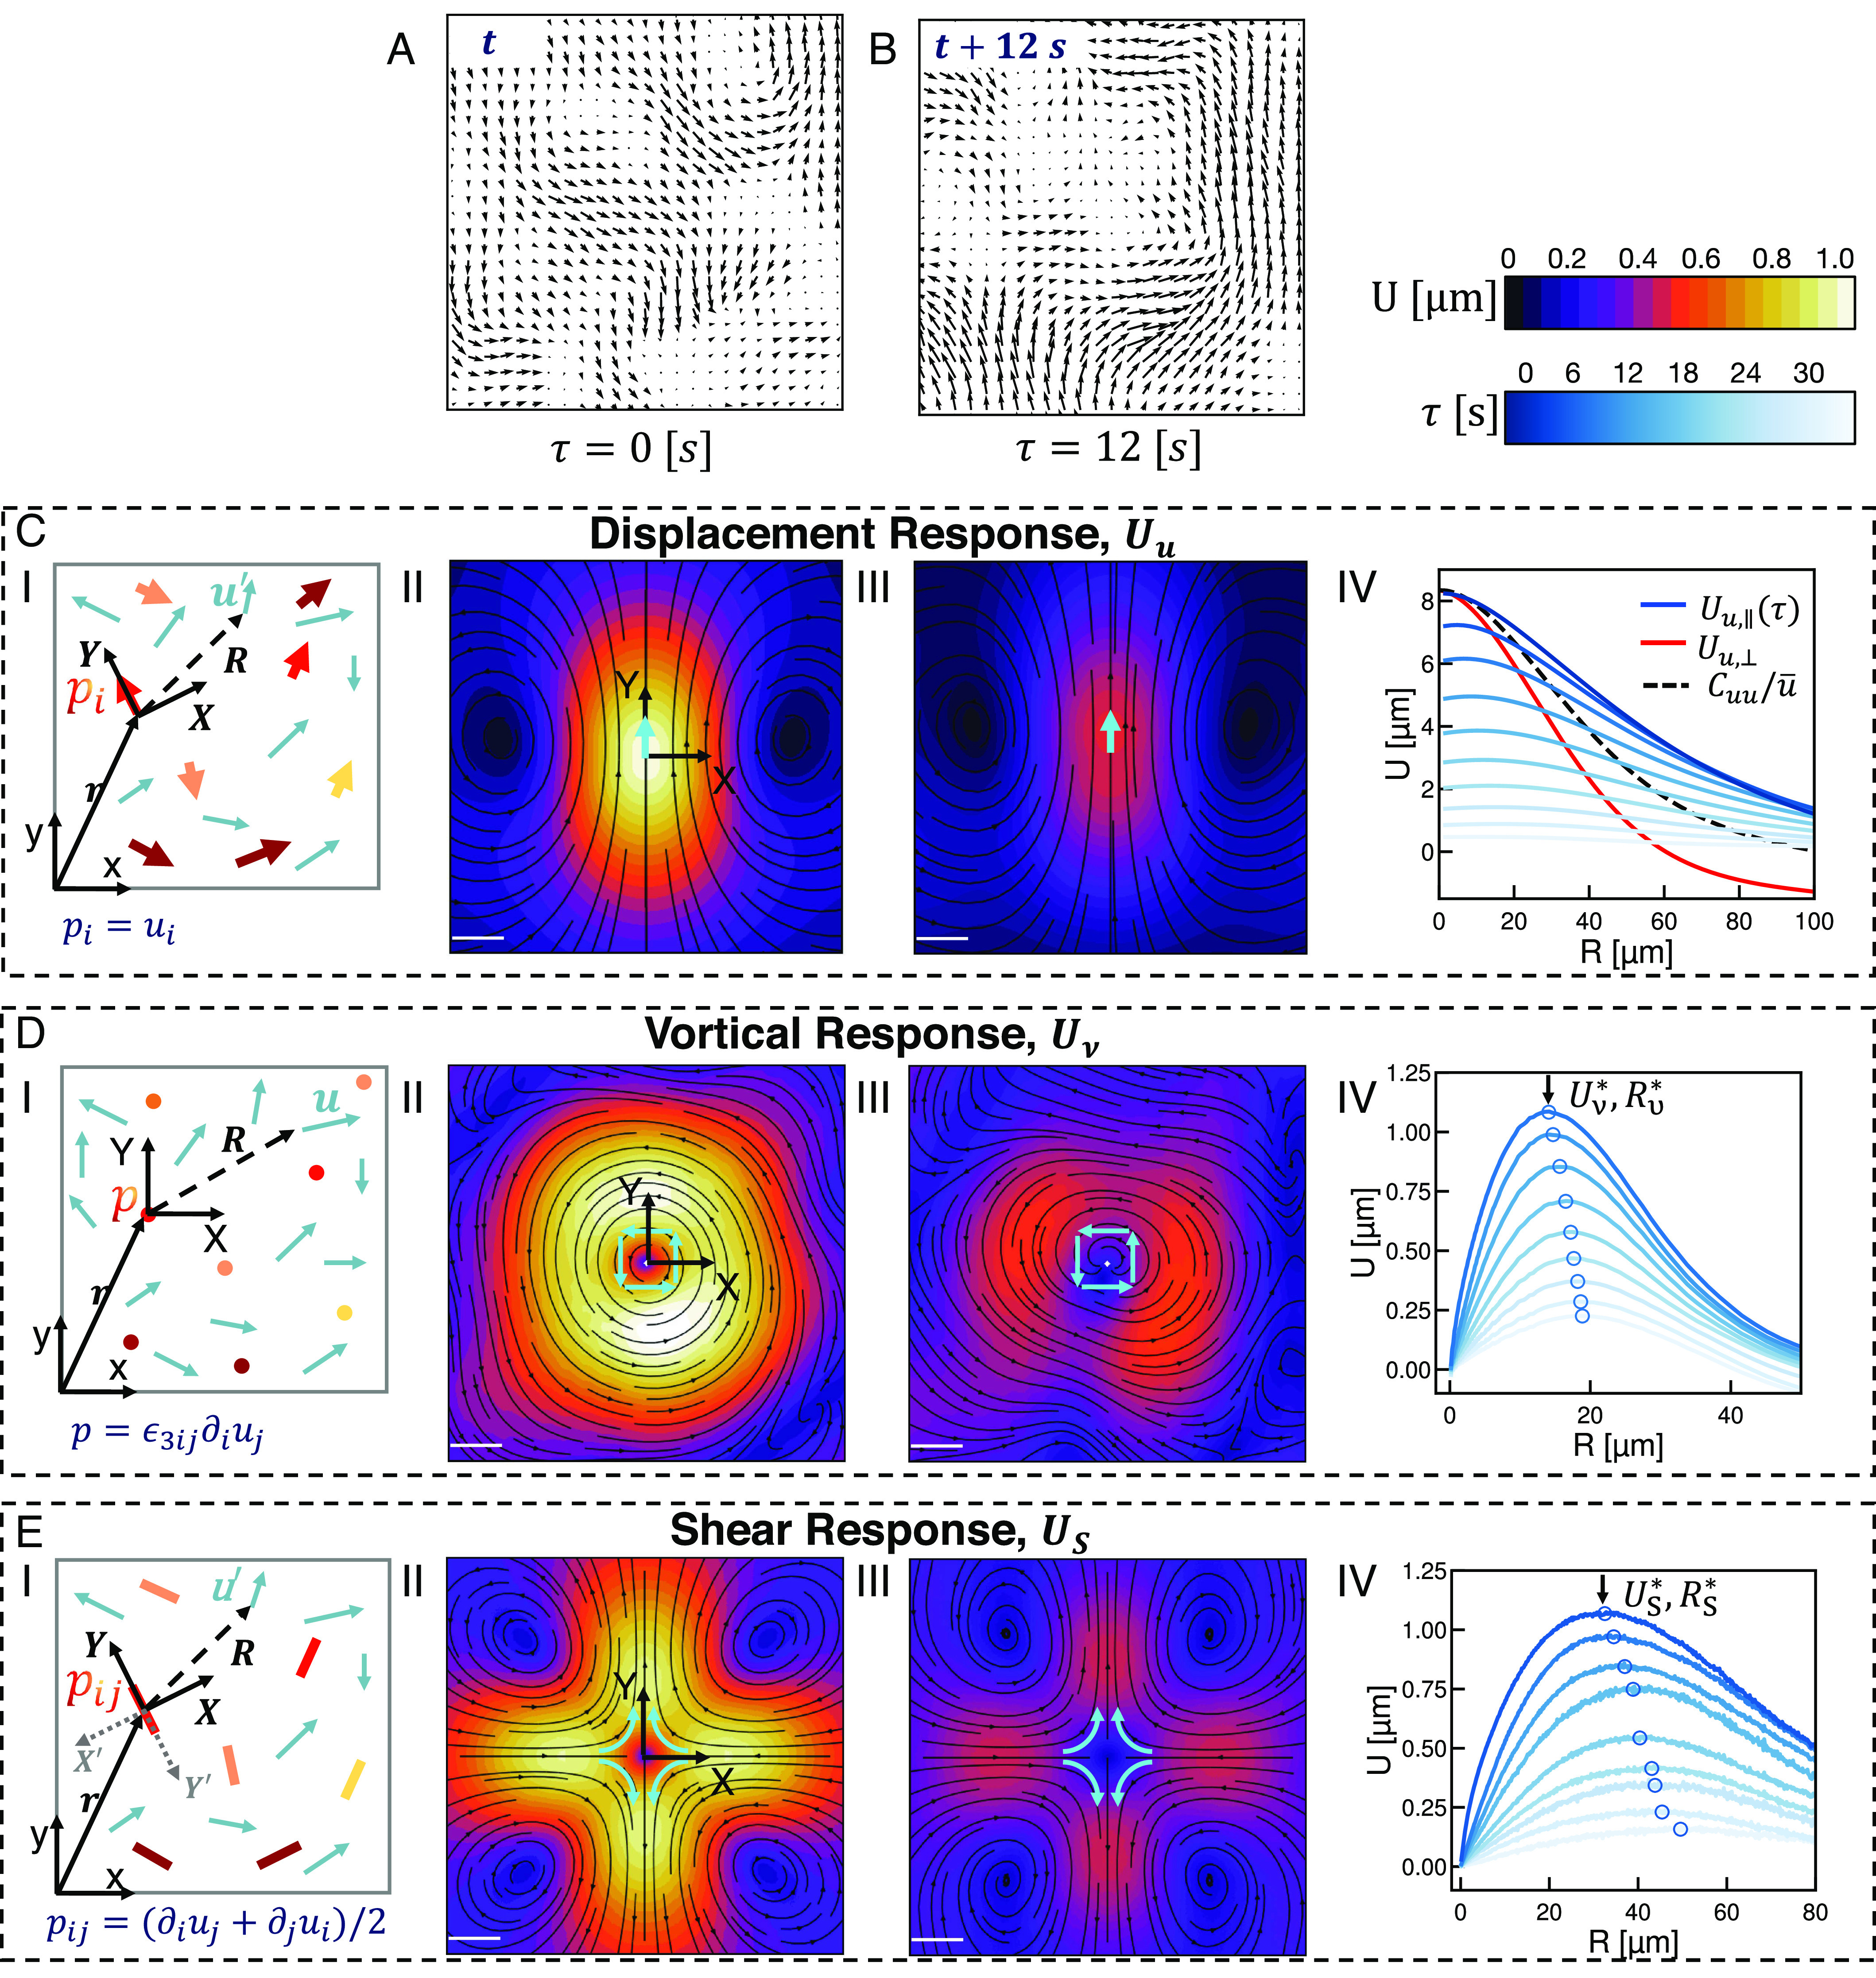
Fig. 1.

Measuring directionally rectified correlations reveals response functions in active materials. (A and B) Displacement fields measured by optical flow from fluorescence microscope images of an active nematic liquid crystal at (A) and (B). Displacements measured over . (i) Schematic of coordinate transformation and ensemble formation for the response of the two-dimensional displacement field to various perturbation fields . is either the displacement field itself, (C), the vorticity field, (D), or the anisotropic strain rate field, (E). (ii) Equal time two-dimensional response of the displacement field in (A) to each of the respective perturbations. Ensembles are constructed such that the axis in (i) is the same as (ii). Streamlines indicate the direction of the resulting response function and color indicates the magnitude (Scale bars, 5 ). (iii) The time delayed response function. The perturbation coordinate system is set at , and the response is measured at . (iv) One-dimensional profiles of the responses calculated at various lag times. Lighter colors indicate longer lag times. (C, iv) One-dimensional profile is constructed by tracing along the major axis (blue). Note that the azimuthal average is simply the average of the major axis trace and the minor axis trace (red). (D, iv) One-dimensional profile is constructed by azimuthally averaging. Model free characteristic deformation and length scales at the various lag times indicated by open circles. (E, iv) One-dimensional profile constructed as a trace along the axis. The origin symmetry of the field shown is unique to divergence free systems. Note the large characteristic length scale in comparison to vortical deformation fields.
