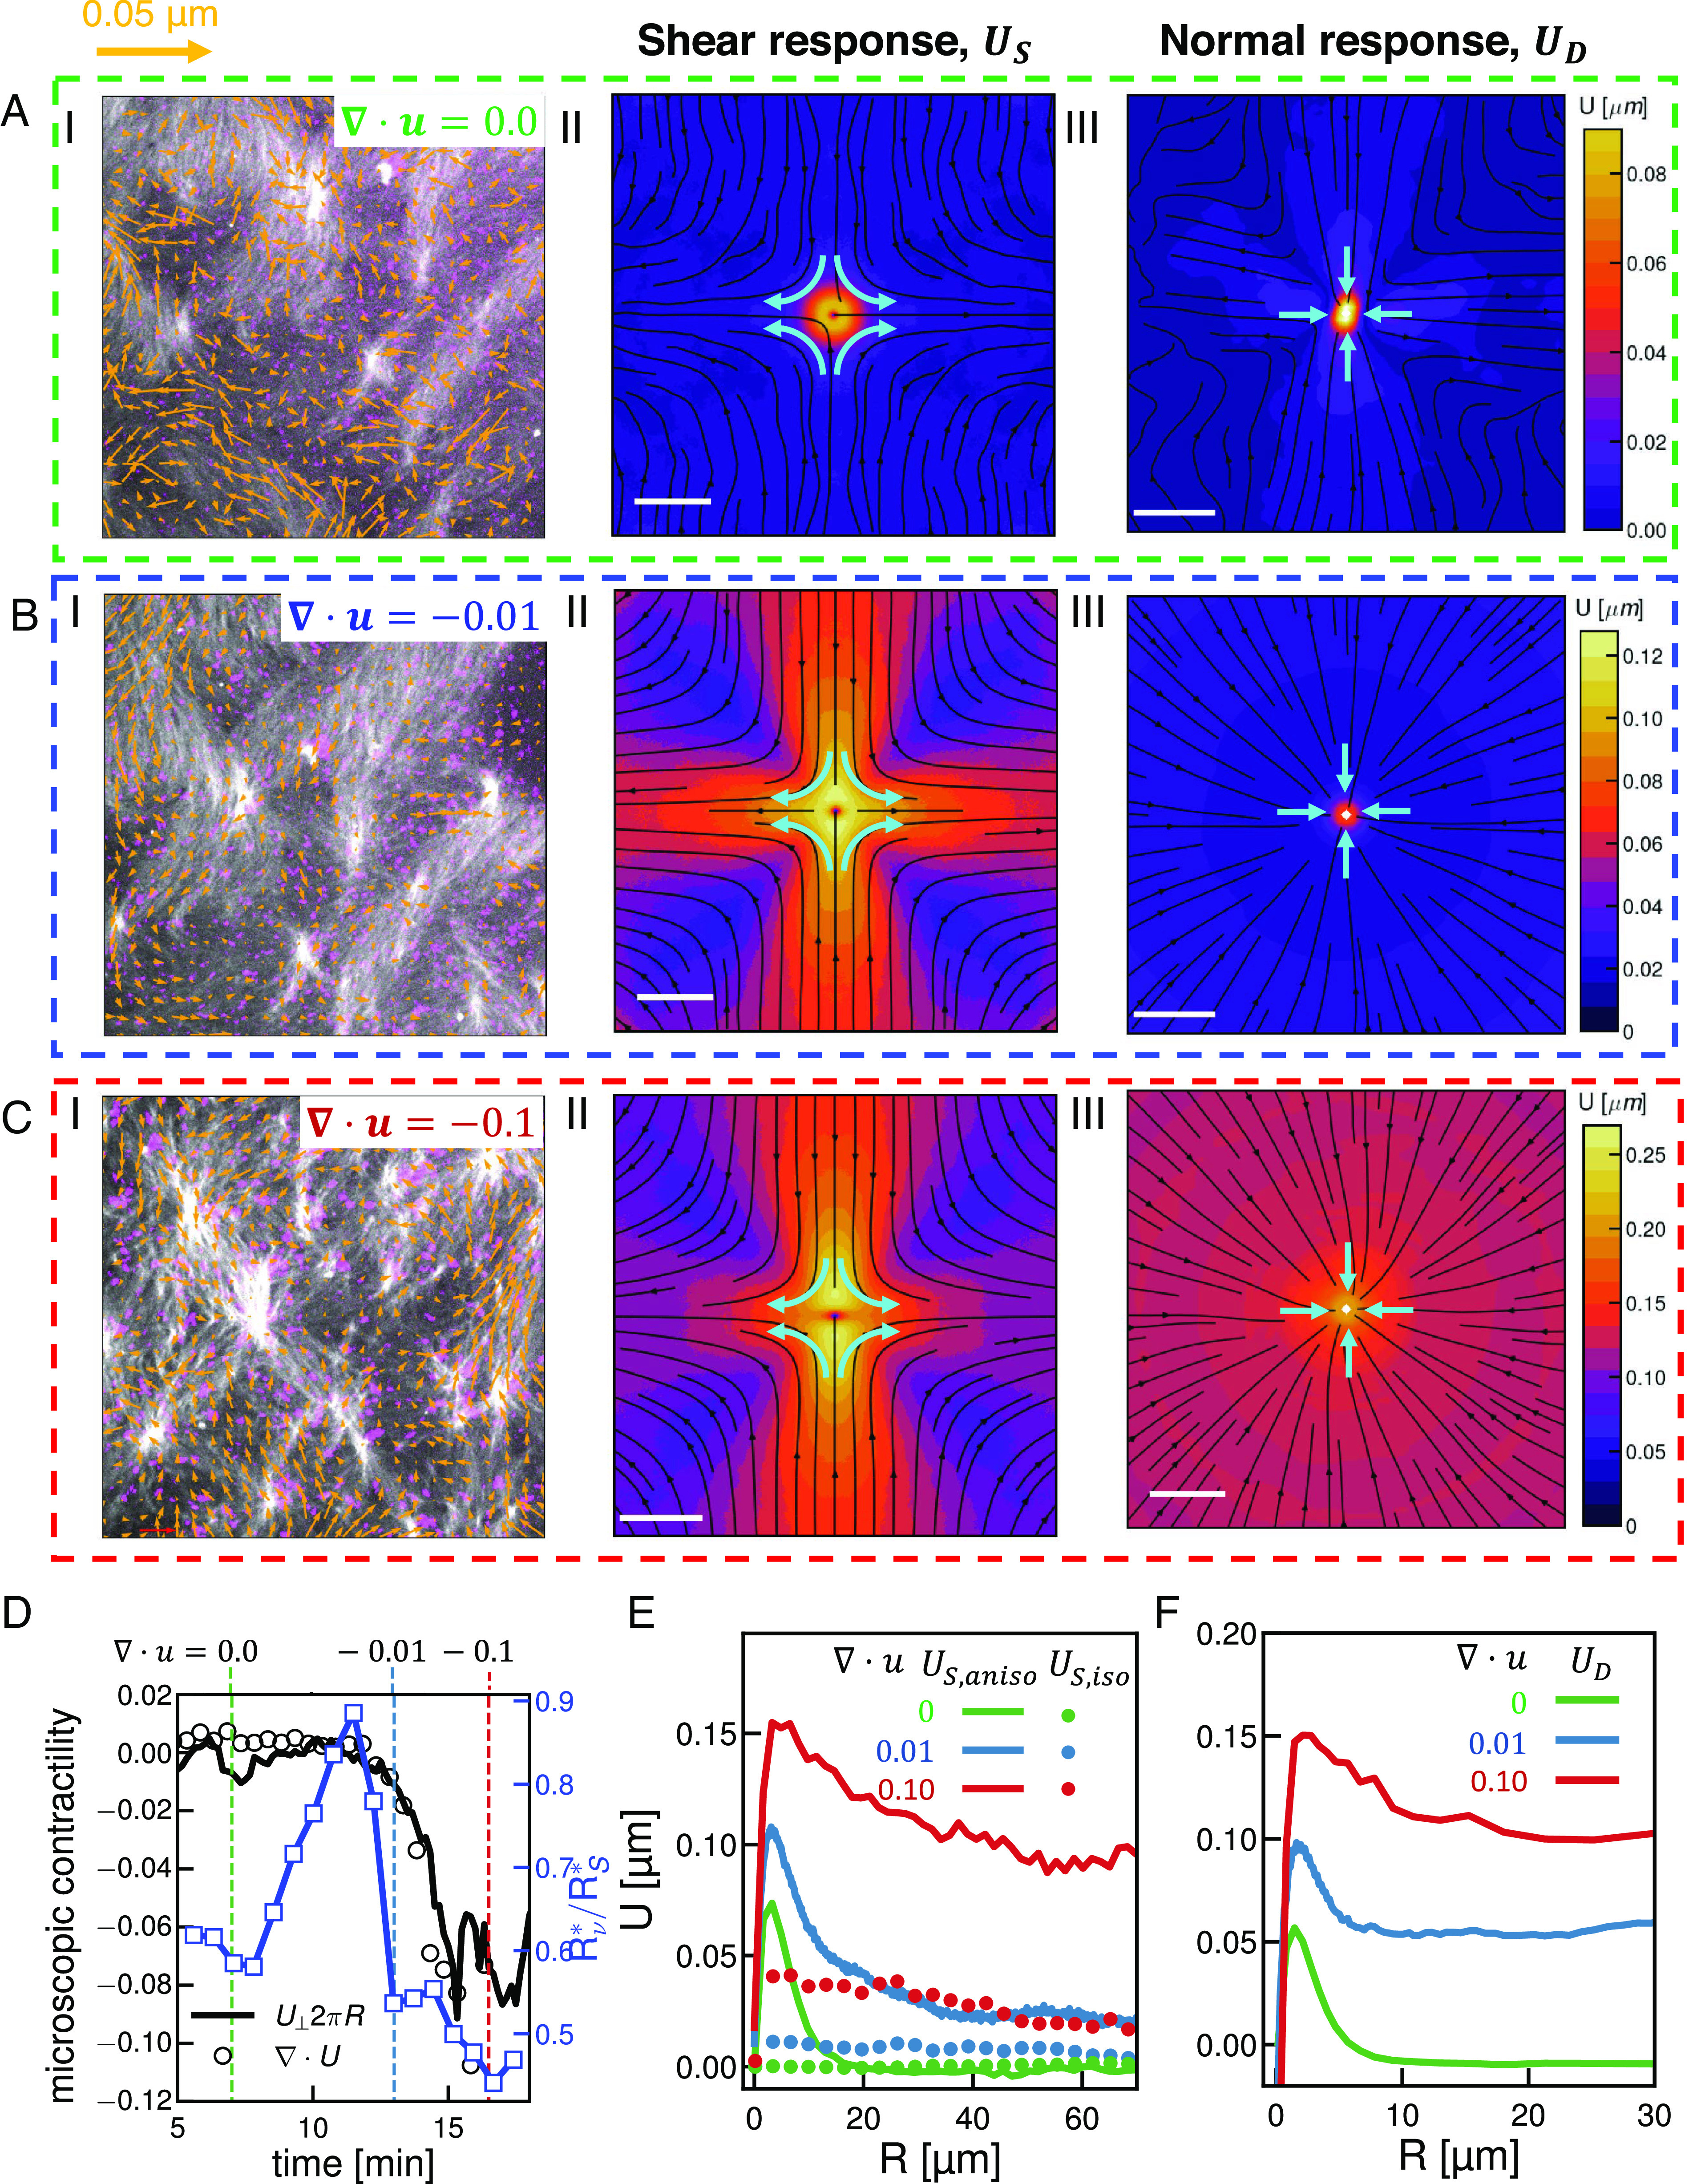
Fig. 2.

Response functions identify key dynamic consequences of contraction in in vitro actomyosin networks. (i) Micrographs of fluorescent actin (gray) and myosin (magenta) overlaid with scaled velocity vectors (orange) for the active gel at various divergences (A–C). Colors correspond to divergences indicated in (D), each box is of the field of view. (ii) Equal time shear response for the velocity fields in (i). (iii) Normal (compression) response for the velocity fields in (i). Streamlines indicate the direction of the resulting correlation field and color indicates the magnitude; scale bars are 5 . (D) Divergence of the velocity field (black circles) as a function of time for a contractile active gel. The azimuthal average of the isotropic shear response per unit area at , (solid black line) agrees with the calculated divergence. The green, blue, and red dashed lines indicate the points taken as characteristic of the gel before contraction, at the onset of contraction, and deep in the contractile regime. Numerical labels indicate the value of divergence at these points. Ratio of characteristic length scales as a function of time (solid blue line, open blue squares). The time axis indicates elapsed time after the addition of myosin motors. (E) One-dimensional traces of the symmetric (, dashed lines), and anisotropic (, solid line) decomposition of the shear response function in (ii) as a function of distance . (F) One-dimensional traces of the normal (compressional) response in (iii) as a function of distance .
