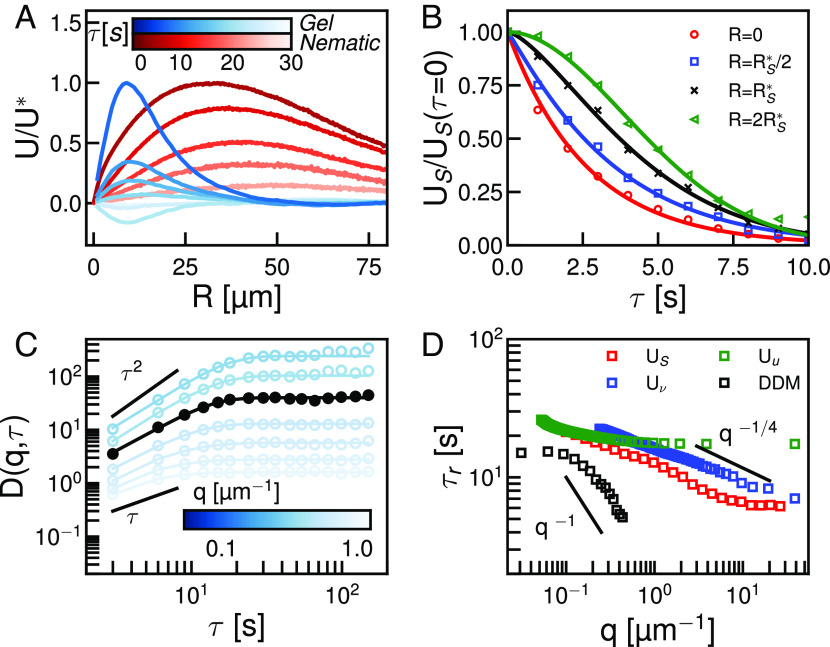
Fig. 3.
Temporal dependence of correlated displacement field reveals characteristic time scales of active materials. (A) Normalized one-dimensional shear response, , for an active nematic (blue) and active gel (red) measured at different delay time (see scale bar). (B) Normalized shear response as a function of delay time measured at different spatial scales with respect to the critical length scale . Experimental data are indicated with symbols solid lines are fit of the data to a stretched exponential. (C) Dynamic structure function at different wave number (see scale). is plotted in black. and scaling are indicated. (D) Characteristic time scales as a function of wave number for DDM (black) and displacement (, green), shear (, red), or vortical (, blue) response.

