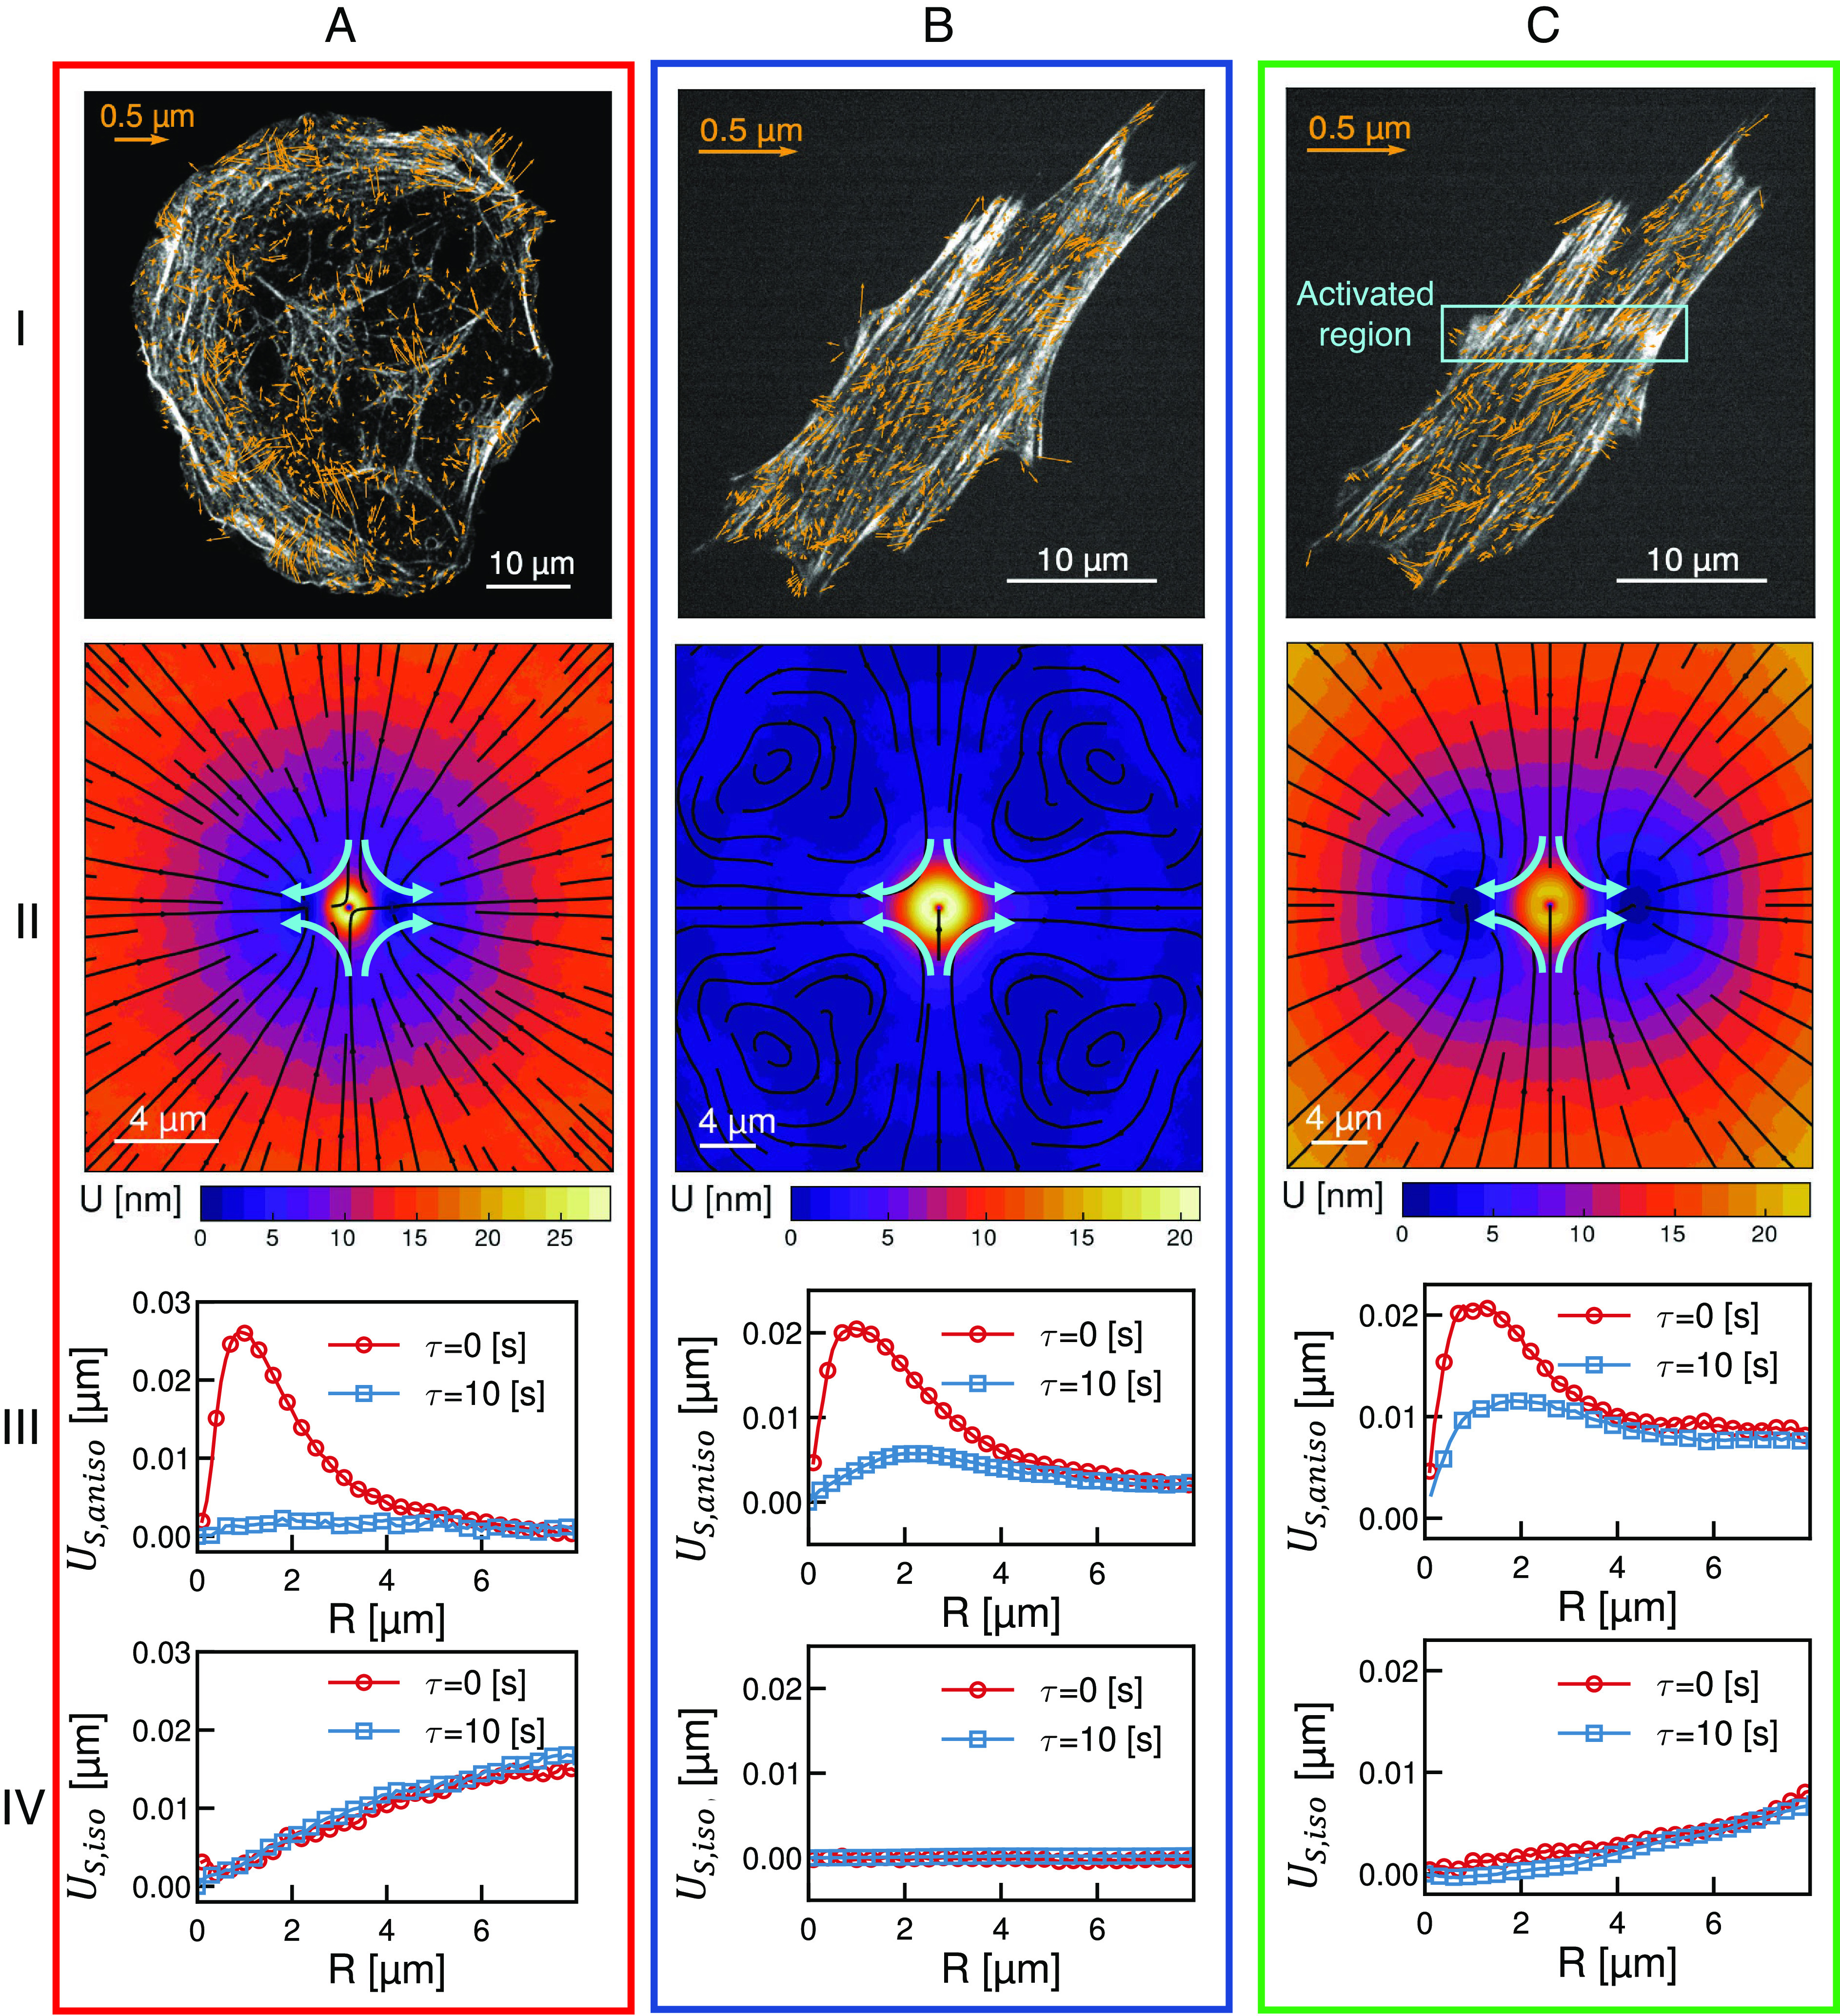
Fig. 4.

Utilizing response functions to differentiate mechanical response of the actomyosin cytoskeleton in living cells. (i) Micrographs of the actin fibers (gray) overlaid with myosin displacement vectors (blue) for (A) transverse arcs (in a U2OS cell), (B) ventral stress fibers (in an NIH 3T3), and (C) regional stimulated ventral stress fibers (NIH 3T3). The orange box in (C, i) indicates the region of optogenetic activation. (ii) Shear response for the displacement fields shown in (i). Streamlines indicate the direction of the response and color indicates the magnitude (see color bars). (iii and iv) One-dimensional traces of the anisotropic, (iii), and isotropic (iv), parts of the shear response shown in (ii) measured at lag times of (red) and (blue).
