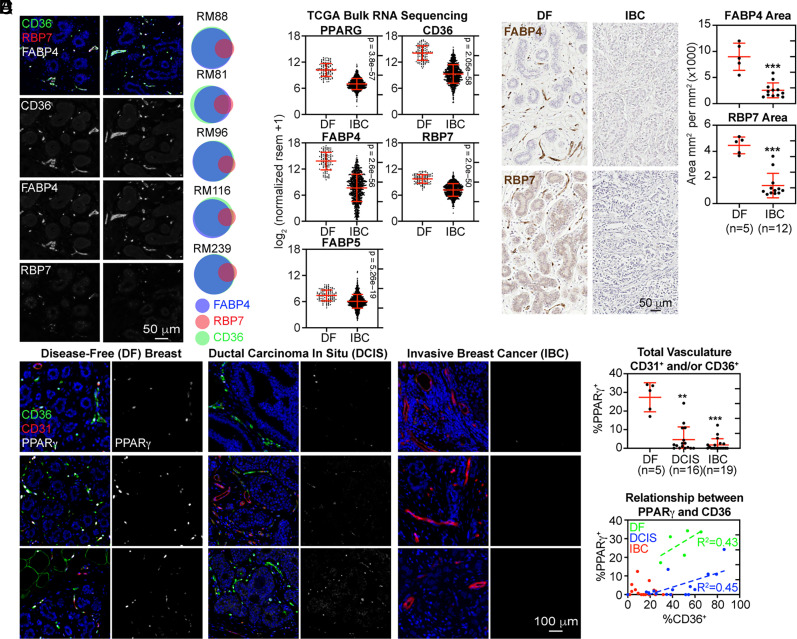
Fig. 4.
Suppression of PPARγ and its target genes in the vasculature during breast tumor progression. (A) FFPE sections of DF breast tissue were subjected to mIHC. For each donor tissue, cells were segmented and binned based on their positive expression of FABP4, CD36, and RBP7 as Euler diagrams. (B) Differential gene expression between DF breast and IBC was analyzed using bulk RNA-Seq data from TCGA. Statistical significance was determined using the Wilcoxon rank-sum test. (C) FFPE sections of DF breast (n = 5) and IBC (n = 12) were immunostained. The percent of the DAB+ area was quantified and normalized to the total area analyzed. (D) FFPE sections of DF breast (n = 5), DCIS (n = 16), and IBC (n = 19) were subjected to mIHC analysis. (E) For each donor, cells were segmented, and the percentage of vascular cells (CD31+ and/or CD36+) expressing PPARγ was determined. (F) The percentage of vascular cells expressing PPARγ (y-axis) and CD36 (x-axis). Linear regression was performed.

