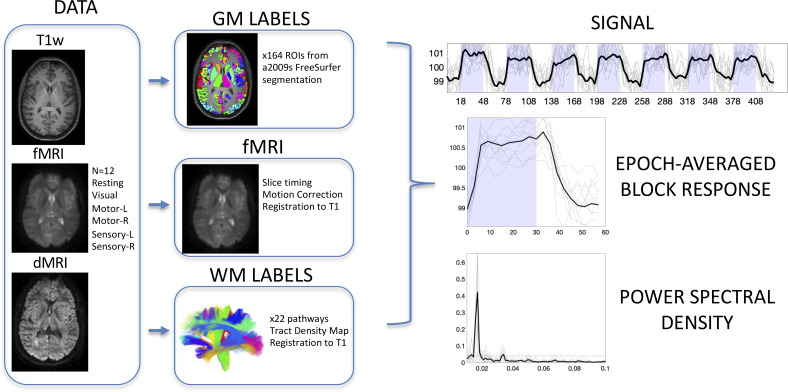
Fig. 1.
Image acquisition, preprocessing, region of interest delineation, and time-locked activation. Data include T1-weighted structural images, fMRI data including resting state and 5 stimuli, and diffusion MRI. Gray matter labels were extracted from structural images, while white matter labels were derived from diffusion MRI fiber tractography. Functional MRI data were corrected for slice-timing and motion, and all data were registered to T1 space for analysis. Analysis included extracting region-averaged signal, from which the epoch-averaged block response can be visualized. Time-locked activation was determined by the power spectral density at task frequency (0.0167 Hz) with statistically significant activation determined by bootstrap analysis at P < 0.01 with FDR correction.

