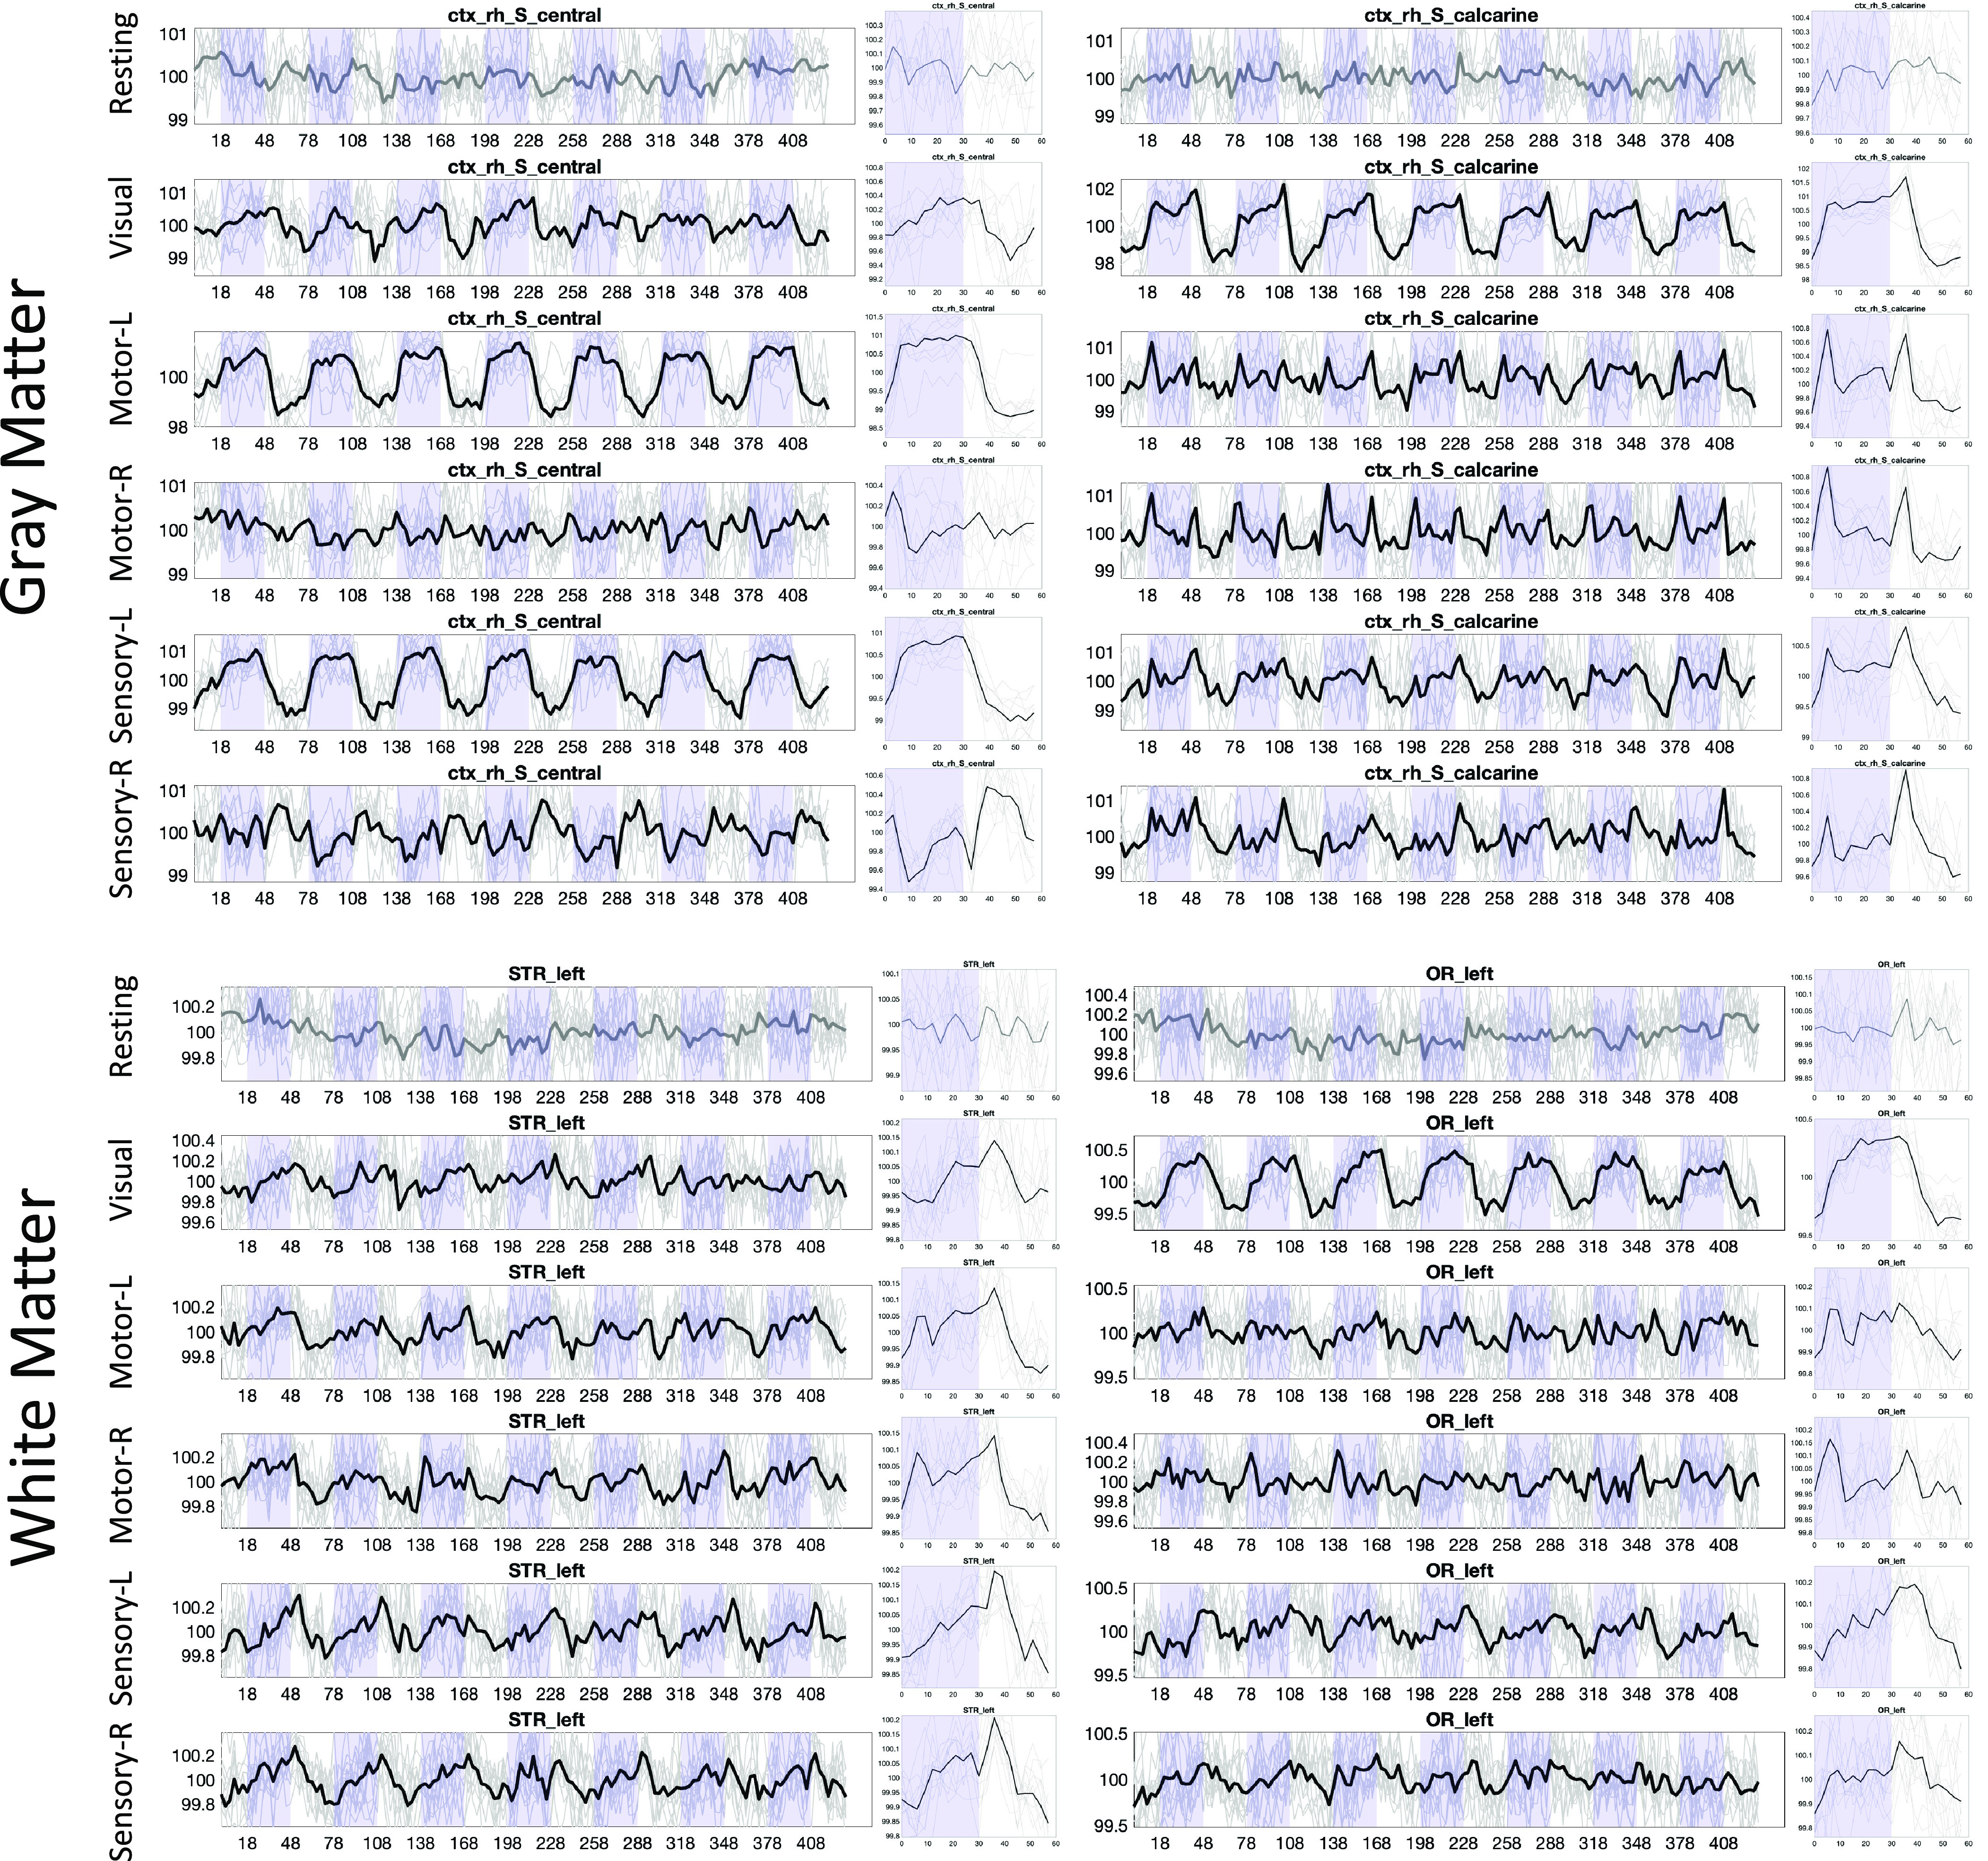
Fig. 4.

Time-locked activation varies across regions and across stimuli, in both white and gray matter. Example signal and epoch-averaged signal are shown for two gray matter and two white matter regions, across all tasks. Plots are shown in BOLD if statistically significant time-locked activation is present.
