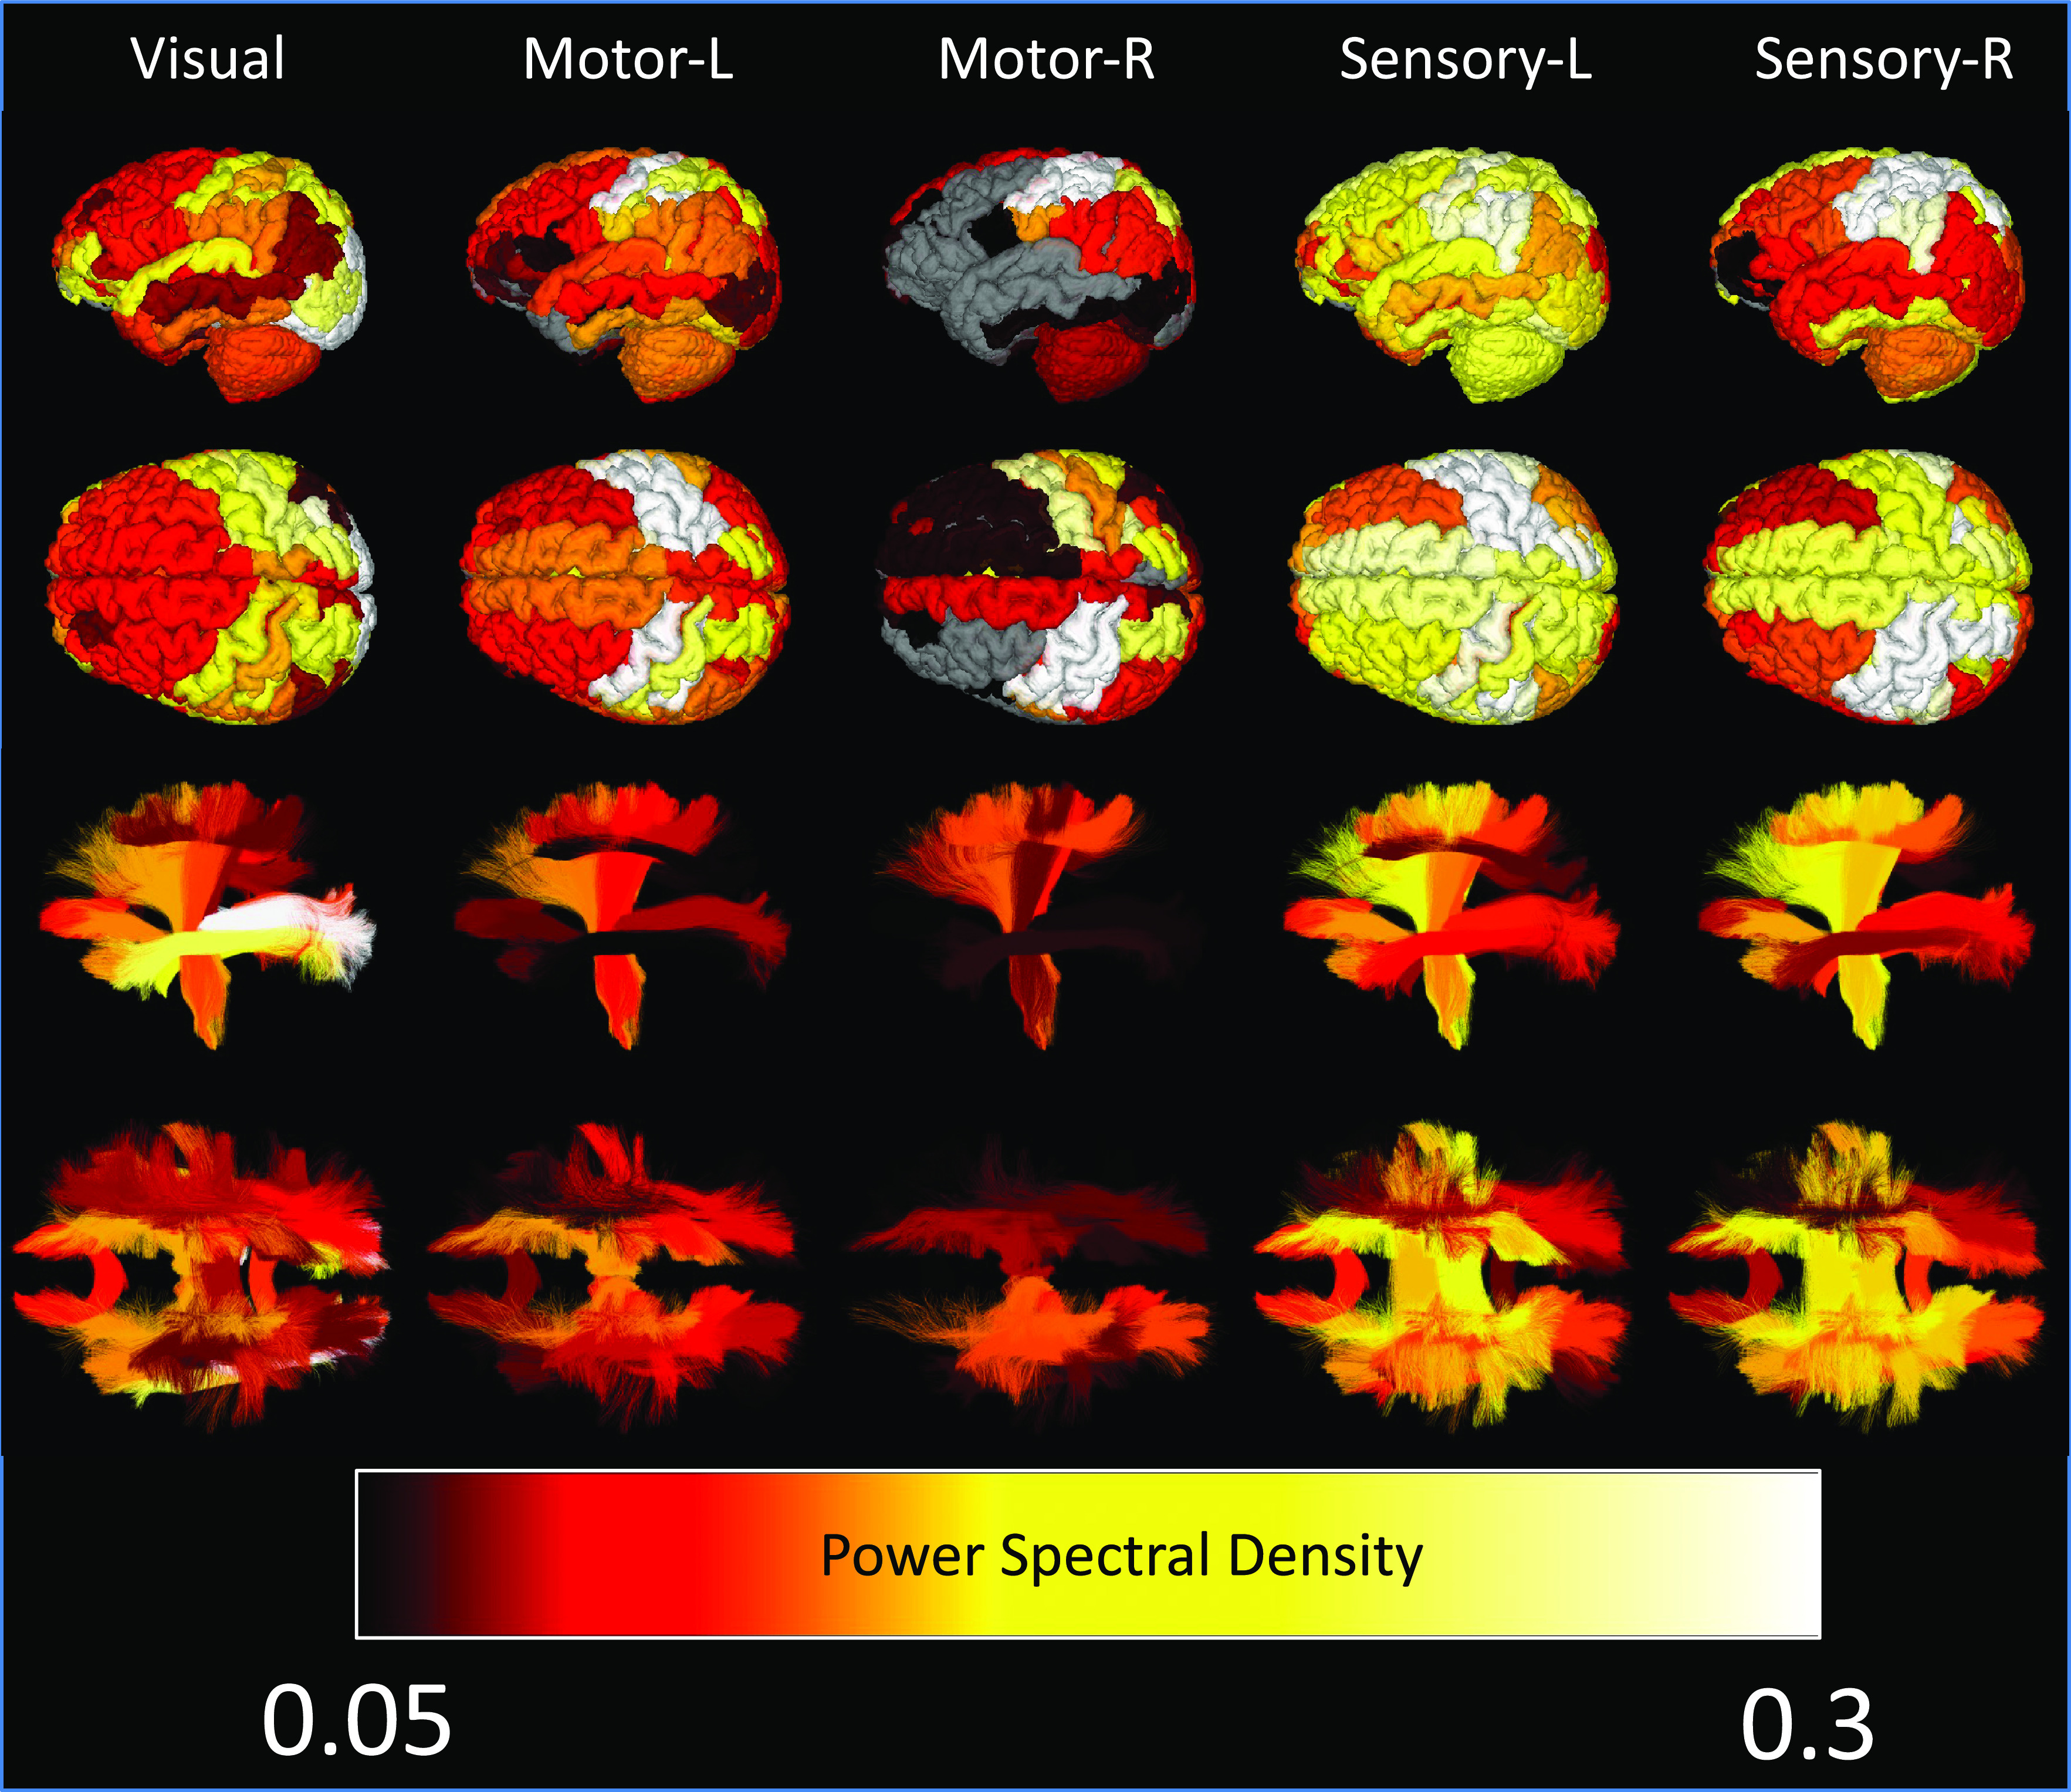
Fig. 5.

Whole brain time-locked signal changes in both white and gray matter. Gray matter regions (Top) and white matter pathways (Bottom) are shown color-coded based on subject-averaged power-spectral density for five tasks. Nonsignificant changes are shown in gray for gray matter, and not visualized in white matter.
