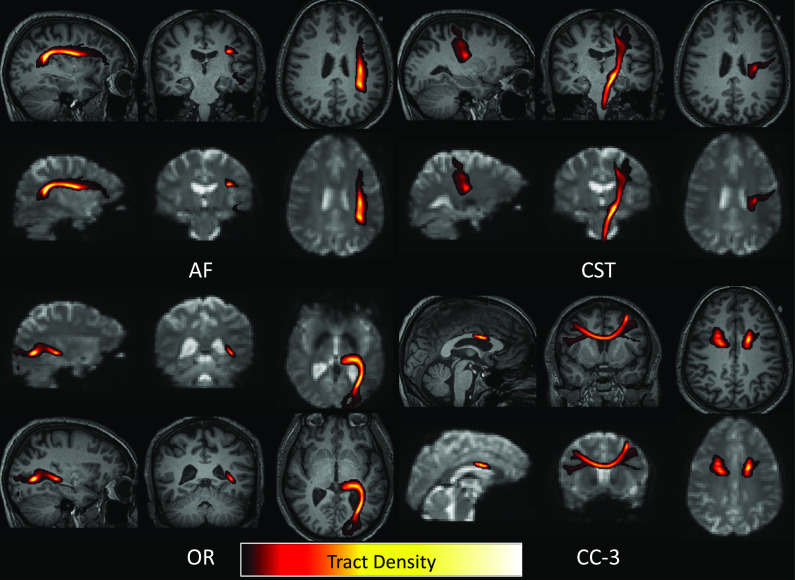
Fig. 6.
Weighting white matter BOLD signal by tract density reduces partial volume effects with gray matter regions. Four example pathways are shown as tract density maps overlaid on T1 images (at 1 mm isotropic resolution) and overlaid on BOLD contrast (at 3 mm isotropic resolution), where the highest density of streamlines is consistently in deep white matter regions.

