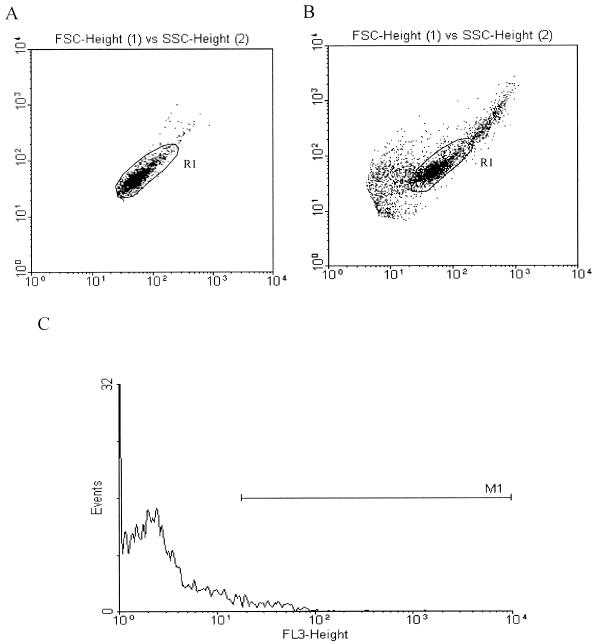
FIG. 3.
Conidia can be liberated from phagocytes through lysis with SLO: flow cytometric analysis. (A) A region (R1) was defined according to the size (FSC) and granularity (SSC) characteristics of the conidia. (B) After phagocytosis and an intracellular stay for 12 h, the conidia were isolated from MDMs by a combination of SLO lysis and mixing with enzymes. Conidia were detected as a distinct population within R1 as defined in panel A, and 2,500 events/sample were gated. (C) After phagocytosis and reisolation as described for panel B; PI staining and fluorescence-activated cell sorter analysis were performed. Histogram analysis of the population within region R1 (B) showed less than 8% PI-positive conidia, as defined by a marker (M1). The numbers of conidia (events; y axis) are plotted against PI fluorescence intensity (FL-3; x axis).

