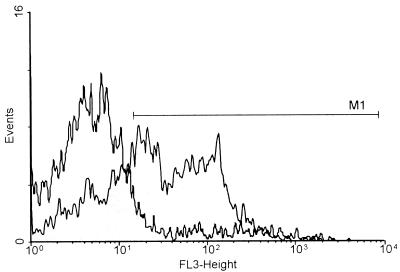
FIG. 6.
Histogram analysis of PI fluorescence in conidia reisolated from AmB-treated MDMs. After a 12-h incubation, the conidia were reisolated from untreated (□) and AmB (1 μg/ml)-pretreated (░⃞) MDMs. Histogram analysis of the PI-stained conidia was performed. An approximately fourfold increase in the numbers of PI-positive conidia was found in samples from AmB-treated MDMs compared with the numbers found in samples from untreated MDMs. The number of conidia (events; y axis) is plotted against the PI fluorescence intensity (FL-3; x axis, logarithmic scale). The marker (M1) defines the range for PI-positive staining.

