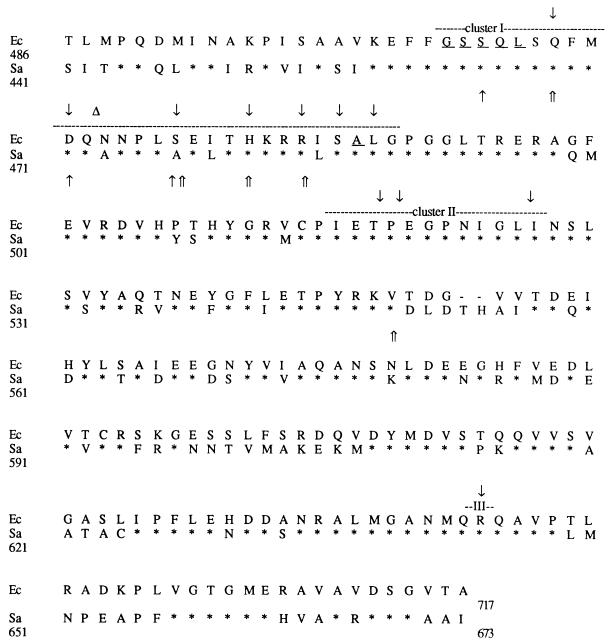
FIG. 2.
Amino acid sequence comparison of the Rif regions of E. coli (Ec) and S. aureus (Sa). Clusters I, II, and III are indicated by dashed lines. Identical amino acids are indicated by asterisks, and gaps are indicated by dashes. Positions known to be involved in rifampin resistance in E. coli are indicated by downward-pointing arrows (mutations) or triangles (insertions) or are underlined (deletions). Mutations leading to low- and high-level rifampin resistance in S. aureus are indicated by single and double upward-pointing arrows, respectively.

