FIG. 1.
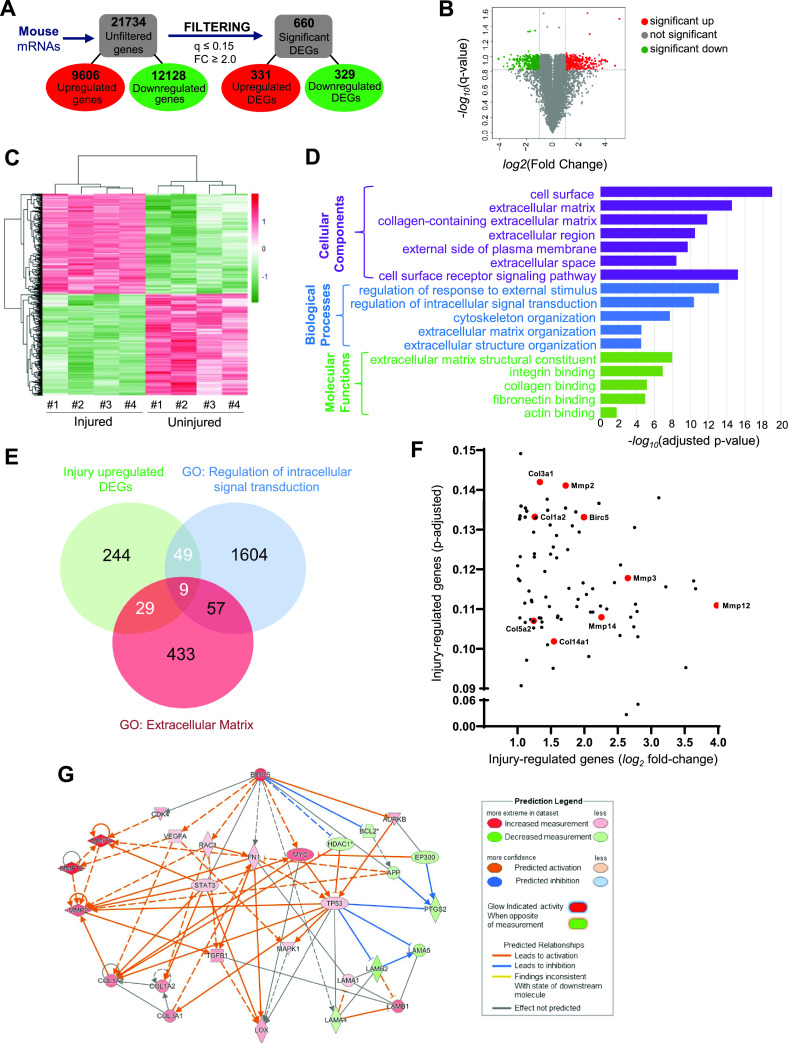
Functional network analysis and predicted network of survivin (Birc5) in VSMCs from injured mouse arteries. (a) Reductions in data magnitude by applying significance thresholds to the raw microarray data (fold change [FC] ≥ 2.0, q value ≤ 0.15). (b) Volcano plot displays the distributions of all detected genes, represented as single dots that are not statistically different (gray), significantly upregulated (red), or significantly downregulated. (c) Heat map displays the Z-scores of the 660 differentially expressed genes (DEGs). (d) Histogram presenting the significant ECM biological processes (purple), cellular components (blue), and molecular functions98 enriched among the 331 DEG upregulated in mouse arteries after injury. (e) Venn diagram of DEGs in mouse vascular injury model. The DEGs upregulated in response to vascular injury (331 genes; green) were compared to GO lists for extracellular matrix (red) and regulators of intracellular signaling transduction (blue). (f) Log2 fold-change and adjusted p values of the genes positively regulated after vascular injury and contained within the GO terms described above. (g) Network diagram of gene interaction pathways between Birc5 (survivin) and various ECM proteins, including collagens (Col1a1, Col1a2, and Col3a1), fibronectin (Fn1), and lysyl oxidase (Lox).

