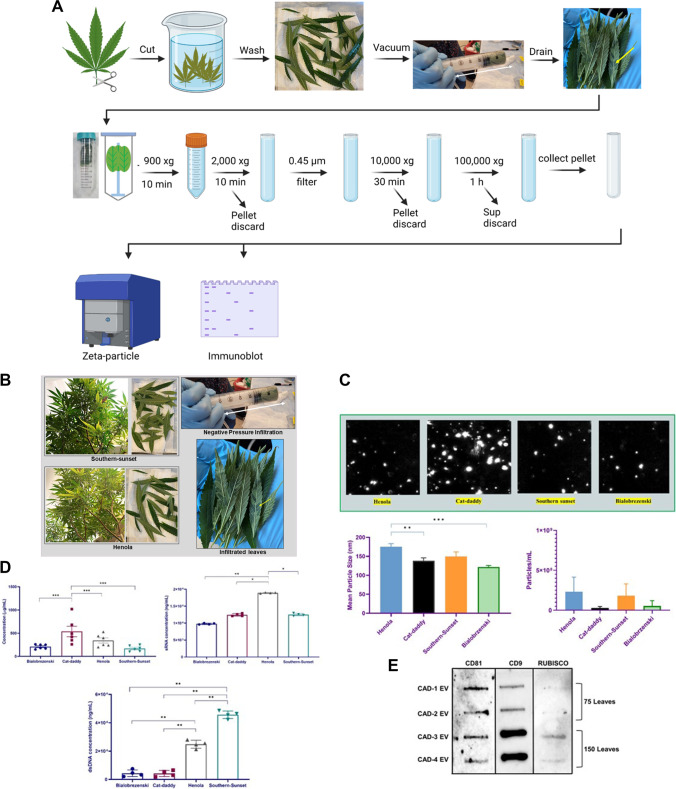
Fig. 1.
Differential expression of cannabis-derived PDEVs. A Diagram showing PDEV isolation workflow. B 75–150 leaves of each cultivar were picked and subjected to washing, negative pressure infiltration, and two rounds of high-speed ultracentrifugation. PDEVs were pelleted and quantitated for further use. C PDEVs particle size and concentration was quantitated via particle tracking analysis. D PDEVs were subjected to protein, RNA, and DNA analysis. E PDEVs were subjected to protein analysis via slot-blot analysis. Statistical analysis on obtained data points was performed using one-way analysis of variance (ANOVA) with Tukey post hoc analysis. Statistical significance is indicated by the mean ± standard deviation (SD) and is defined as P ≤ 0.05 ( ∗), P ≤ 0.01 (∗ ∗), and P ≤ 0.001 (∗ ∗ ∗)

