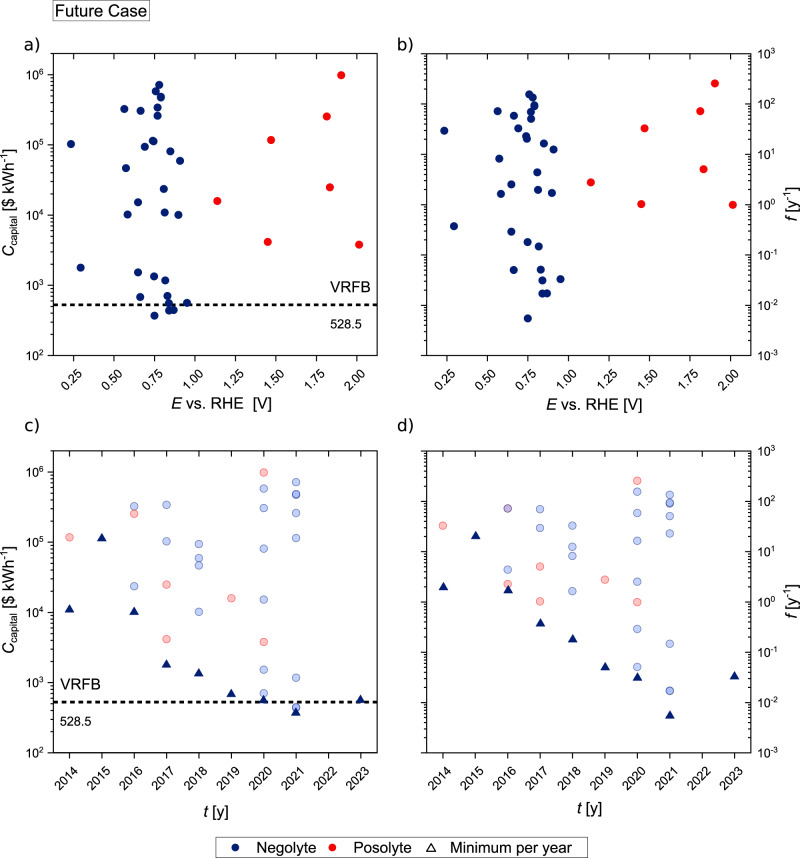
Fig. 2. Side-by-side comparison of capital costs and capacity fade rates referenced to the redox potential or publication year of each active material using Future Case calculations.
a Future Case capital costs Ccapital and b capacity fade rate f, as a function of the active material redox potential E referenced to the proton redox potential at the pH value (RHE) of the individual electrolyte for negolyte and posolyte materials. c Overview of Future Case capital costs Ccapital, and d capacity fade rate f, in relation to each active materials individual publication year. The minimum capital cost value for each publication year is represented in dark color triangles while values above the minimum are depicted in lighter color (source data are provided as a Source Data file).

