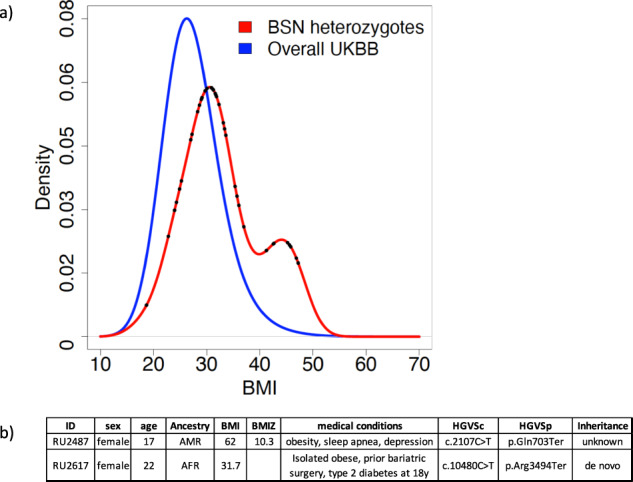
Fig. 2. BMI density distribution.

a The BMI density distribution for pLoF BSN heterozygotes is shifted to a higher BMI than the overall UKBB cohort. A.) There is an apparent bi-modal distribution for the BSN pLoF heterozygotes. This distribution is not explained by putative protein functional consequences (CADD score), genomic physical location, phylogenetic conservation, epigenetic markers, or histone modification across different stages. The bimodal may be simply due to the small number of carriers and the bin size, if the bin size is increased from 2 to 5, the binomial distribution goes away. The distribution difference between overall cohort and UKBB heterozygotes was tested using the Kolmogorow-Smirnov method (p = 1.4e-05). The dots in the red curve represent the BMI of the individuals with predicted deleterious BSN variants. b Phenotype of BSN pLoF heterozygotes in the Columbia cohort.
