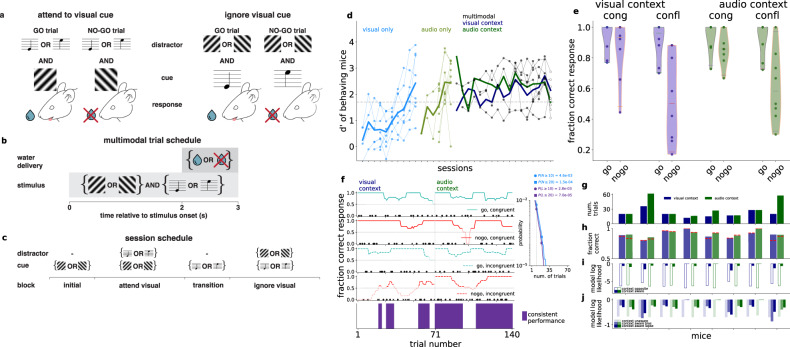
Fig. 1. Behavioral paradigm.
a Stimulus and reward structure in the ‘attend visual stimulus’ (left) and ‘ignore visual stimulus’ (right) tasks. b Trial structure. Stimuli were presented for three seconds, and a three-seconds rest period followed (time-out extended the delay to ten seconds). Water was available after two seconds from start. c Structure of an experimental session. d d′ values for individual sessions of 8 animals, in the visual and auditory discrimination tasks (light blue and light green, respectively), followed by the cross-modal task, where each session combines the attend visual (dark blue) and attend auditory (dark green) context in random order; expert level performance was defined when combined d’ exceeded 1.7 (dashed horizontal line). Each filled dot represents the averaged d′ of one animal in a given training session, the empty circle represents the recording session. Individual animals (thin lines) and averages over mice (thick lines) are shown. Most mice were trained for fewer sessions than the full duration of the three session types. Session days are aligned to the last session for each animal. Multimodal sessions are overlaid for easier comparison of performances. e Fraction correct of responses grouped by congruence and expected action (‘go’ or ‘no-go’) in the two contexts (blue and green). Individual animals (n = 8, dots) and the whole population (violin plots, red line: mean across animals) are shown. f Behavioral performance for an example animal during a recording session for different trial types (top four panels). Success and failure trials are marked by filled circles and crosses, respectively. Lines show moving averages, and darker shading indicates above chance performance. Consistent trials (bottom panel, purple) correspond to periods with above chance performance on all four trial types. Inset: probability of (horizontal axis) the number of trials, N, in (light blue) and length of consecutive consistent trials occurring at least once, L, of (purple) the session in one context (70 trials) under a model in which the animal makes random decisions with lick rate matching the empirical rate in incongruent trials (p = 0.75). Legend: cumulative probability of at least (≥) the number and at least one occurrence of at least the length for the criteria for consistency (N,L = 10, vertical dashed line, circles) and typical mice (N,L = 20, squares). g Number of consistent trials for individual mice (n = 8) for the visual (blue) and audio (green) context. h Fraction correct performance for all trials in consistent periods (colors as above), and for incongruent ‘no-go’ trials only (red dashed lines). i, Model log-likelihoods averaged over consistent incongruent trials in the visual (blue) and audio (green) context for individual mice (n = 8), for a model targeting the opposite modality (empty bars), and the correct modality. j Same as i, but with a context agnostic model with mean choice lick bias (faint colors), and a context-aware model with a fitted bias or lapse parameters (intense saturated colors).

