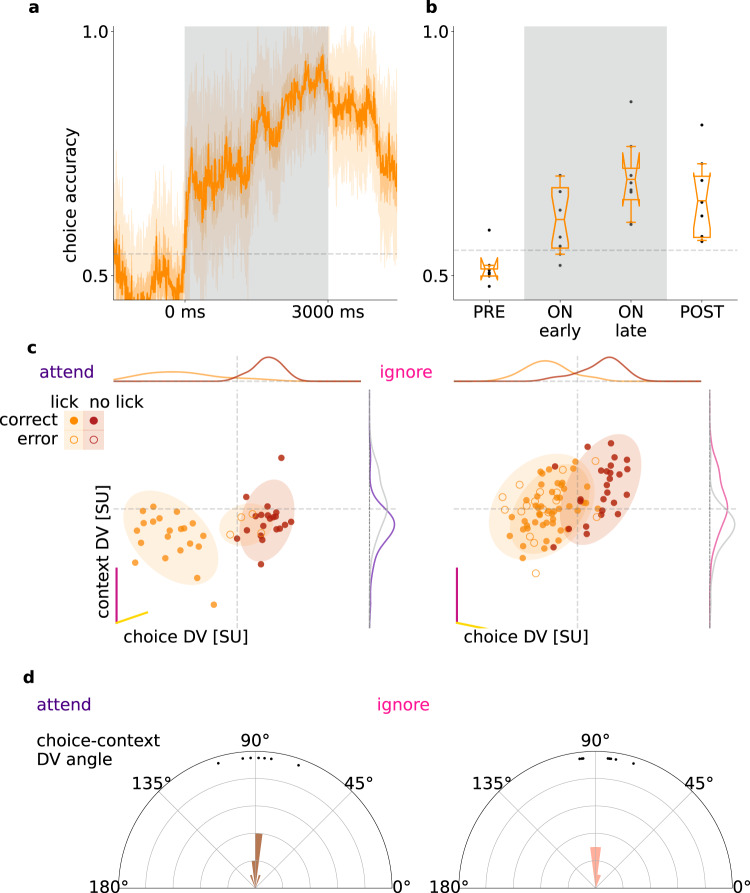
Fig. 6. Choice-related activity.
a Decoder performance in 50-ms sliding windows for the choices of an example animal (‘lick’/‘no-lick’). Gray dashed line indicates shuffled baseline. b Average performance of choice decoder prior to stimulus onset (PRE), during stimulus (ON), and after stimulus (POST), for all animals (dots, n = 8). Box and whiskers denote 25–75, and 2.5–97.5 percentiles respectively, midlines are means, notches are 95% confidence levels. Gray lines as in (a), but averaged over animals. c Population responses projected on the DV subspace of context (magenta line) and choice decoders (yellow line) in individual trials (dots) and their estimated normal distribution (mean and 2 std, shaded ovals) in different task contexts (left and right panels) and with different choices the animal made (orange and red for ‘lick’ and ‘no-lick’, respectively) for an example animal. Since the choice decoder changes across task contexts, different DV subspaces are used (left and right panels for ‘attend’ visual and ‘ignore’ visual context, respectively). Distributions show the marginal of population responses (gray lines indicate the distributions for the opposite context). d Histograms of the angle between context and choice DVs across animals (dots) in the two task contexts (left and right).

