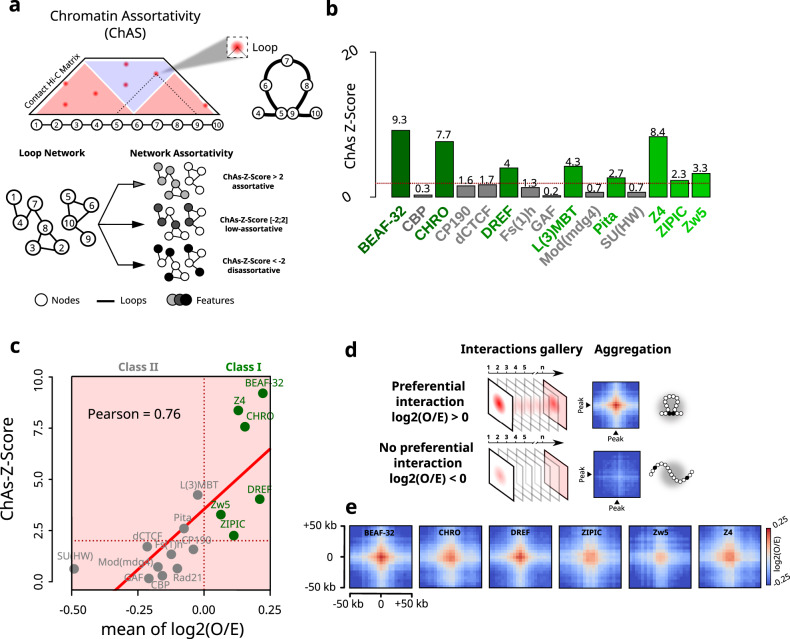
Fig. 1. Genomic regions displaying preferential interactions are predominantly bound by chromatin insulators.
a Cartoon illustrating Chromatin Assortativity (ChAs) of chromatin binding factors in a network of chromatin contacts. 5-kb genomic bins are represented by nodes in the chromatin network. Nodes are connected to each other if they form loops in Hi-C data, called by Chromosight29. Nodes are color-coded according to the presence or absence of a given chromatin binding factor (features). The assortativity is then calculated for each different factor (see “Methods”). b Bar plot illustrating ChAs Z-Scores for 15 IBPs in the nc14 chromatin network classified by alphabetical order. The horizontal red dashed line represents the ChAs Z-Score = 2 threshold considered in this study. c Pearson’s correlation between ChAs Z-Scores from ChAs (y) and mean of log2(O/E) from APA (x) for the 15 IBPs tested. Class I and II are delineated by a vertical red dashed line centered at log2(O/E) = 0. d Cartoon illustrating the Hi-C aggregate map procedure around pairs of specific chromatin binding factors (peak). The first line illustrates the log2(O/E) aggregate map expected for a given factor involved in preferential contact formation and the second for a factor not involved in preferential contact formation (see “Methods”). e Aggregate Hi-C plots of Class I IBPs regions in nc14 embryos20. Maps show the log2(O/E) in a 50 kb window around the crossing point of two Class I IBPs regions: BEAF-32, CHRO, DREF, ZIPIC, Zw5, Z4. Source data are provided as a Source Data file.

