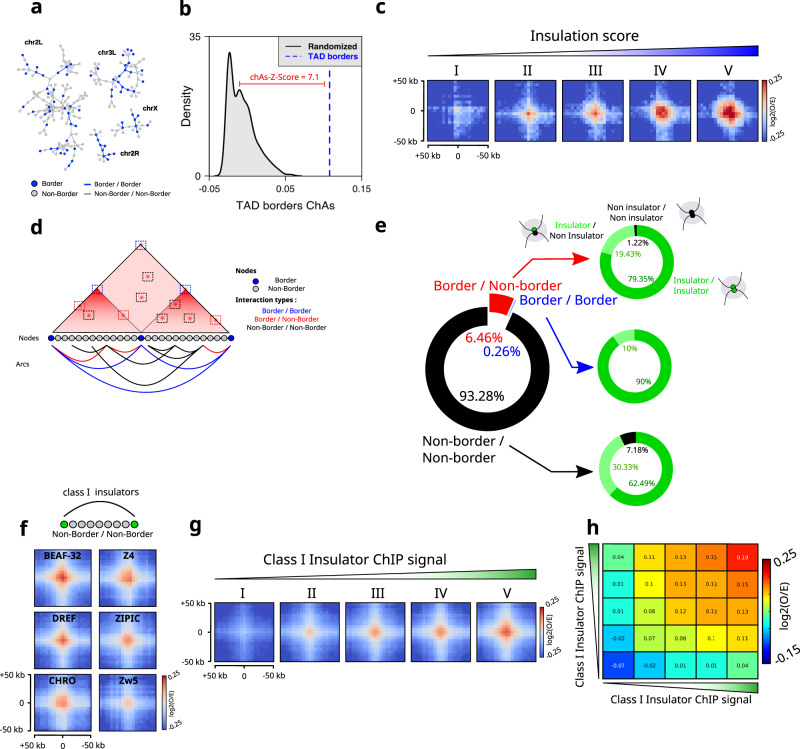
Fig. 2. Border–border and non-border interactions are favored by an increase in insulation score and an increase in IBPs binding, respectively.
a Chromosight chromatin subnetworks from Hi-C data in nc14 embryos20. Each node of the network is a chromatin fragment, blue nodes represent nodes where a TAD boundary is found, and edges represent significant 3D interactions. b ChAs Z-Score for TAD borders (blue) versus distribution of ChAs scores for randomized networks (black). The ChAs Z-Score is calculated for TAD borders based on comparing ChAs values with the distribution of the ChAs in randomized networks (see “Methods”). c Aggregation Hi-C plots for TADs borders in nc14 embryos stratified into five equal-size category groups (I, II, III, IV and V) with an increasing level of insulation score. d Cartoon illustrating the different types of interaction observed in Hi-C dataset. Genomic bins are represented by color-coded nodes. Arcs represent interactions between pairs of genomic bins. Border/Border interactions are shown in blue, Border/Non-Border in red and non-border/non-border in black. e Donut chart representing the loop distribution called by Chromosight into the different types of interactions (left panel). Donut charts illustrating the quantification of Class I IBPs bound on each side of the anchored interaction (right panel). f Aggregation Hi-C plots for non-border regions bound by Class I IBPs in nc14 embryos. g Aggregation Hi-C plots for Class I IBPs in nc14 stratified into five equal-size category groups (I, II, III, IV and V) with an increasing ChIP signal. h Log2(O/E) average interaction frequencies between five categories of Class I IBPs regions ranked by increasing ChIP signal in nc14 embryos. Source data are provided as a Source Data file.

