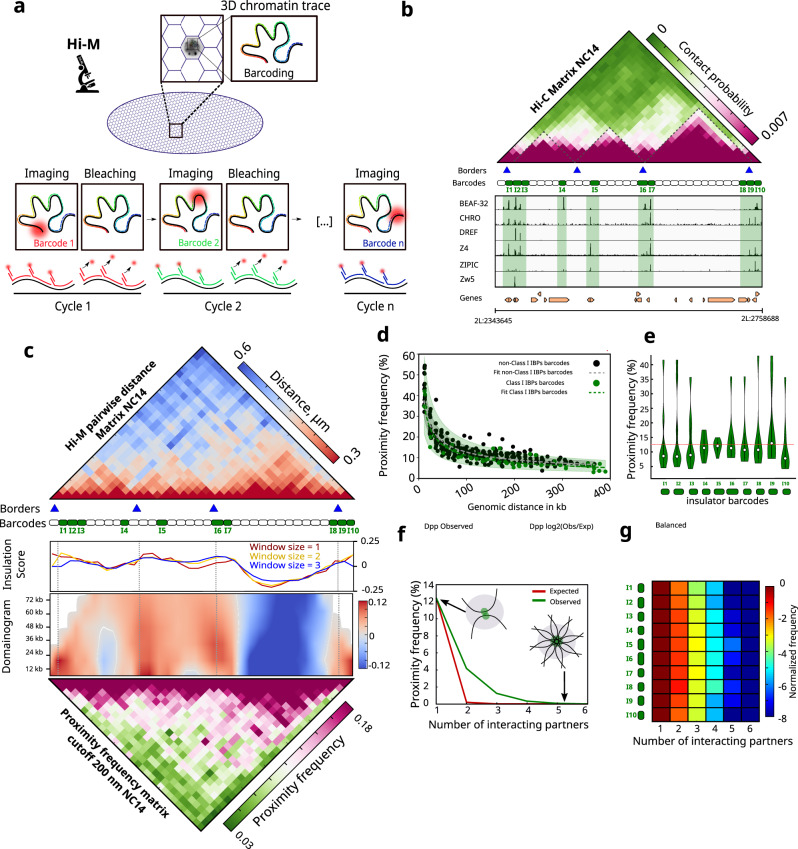
Fig. 3. Hi-M reveals visible interactions between insulator-bound chromatin regions.
a Cartoon illustrating the imaging-based strategy used to study chromosome conformation at the single cell level in intact Drosophila melanogaster embryos (Hi-M). b Top: nc14 Hi-C matrix along the dpp locus (2L:2343645-2758688) in Drosophila melanogaster (dm6). Purple and green represent high and low contact probabilities, respectively. Identified TADs borders from nc14 embryos20 are represented by blue triangles. TADs are highlighted on the matrix with black dashed lines. Barcodes used for Hi-M sequential imaging are represented as boxes, with barcodes bound by Class I IBPs displayed in green. Bottom: ChIP-seq profiles for Class I IBPs (BEAF-32, Chromator, DREF, Z4, ZIPIC, Zw5) aligned with genomic coordinates and gene locations. c Top: Hi-M pairwise distance (PWD) matrix for nc14 embryos constructed from 23531 traces from 22 embryos. Red and blue represent low and high distances, respectively. Middle: insulation score derived from Hi-M data with different window sizes (1, 2 and 3 bins), and domainogram (see “Methods”). Bottom: proximity frequency matrix from nc14 embryos (cutoff distance: 200 nm). Pink and green represent high and low proximity frequencies, respectively. d Scatter plot illustrating the dependence of proximity frequency with genomic distance (cutoff distance: 200 nm) for Class I IBPs barcodes (green) and for non-Class I IBPs barcodes (black). Dashed black and green lines at the center of the error bands represent polynomial fits for each distribution, along with 95% confidence intervals. e Violin plot distributions representing the frequency with which each insulator barcode interacts with each other insulator barcode in our oligopaint library for nc14 embryos (see “Methods”). The dashed red line represents the mean. f Observed and expected proximity frequency versus number of interacting partners for Class I IBPs barcodes for nc14 embryos (green and red, respectively). g Histograms of Class I IBPs preferential interaction as a function of the number of interacting partners normalized by the number of pairwise interactions for nc14 embryos. Insulator barcodes are indicated on the left (I1–I10). The color-scale represents the normalized frequency in log2-scale. Source data are provided as a Source Data file.

