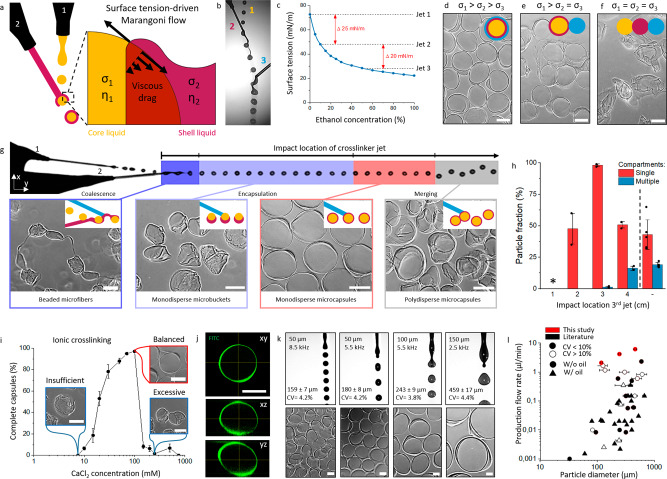
Fig. 2. Ultra-high-throughput production of hollow microcapsules using in-air microfluidics.
a Schematic of the surface tension-driven in-air encapsulation process. b Microphotograph of in-air aqueous layering process that enables microcapsule production. c Used surface tension differences between microjets were obtained using distinct EtOH concentrations. d–f Microphotographs of microparticles formed with stepwise tuning of microjet surface tensions. Schematics indicate the surface tension-driven encapsulation status per condition. Yellow indicates the core solution, red indicates the shell precursor solution and blue indicates the crosslinker solution. g Schematic showing the effect of the impact location of the crosslinker microjet with microphotographs of resulting micromaterials. Insert schematics indicate the surface tension-driven encapsulation status per condition. Yellow indicates the core solution, red indicates the shell precursor solution and blue indicates the crosslinker solution. h Quantification of microcapsule formation efficiency and number of compartments per microcapsule dependent on third jet impact location (n = 60 microparticles per condition). * Indicates the formation of beaded microfibers void of individual microcapsules. Data is presented as mean values ± SD. i Analysis and microphotographs of insufficient, balanced, and excessive ionic crosslinking at different core-microjet CaCl2 concentrations (n = 350 microparticles). Data is presented as mean values ± SD. j Confocal analysis of a representative FITC-conjugated dextran (2000 kDa)-alginate microcapsule (n = 3 experiments). A representative microparticle k Microphotographs and analysis of droplet formation and resulting microcapsules using different nozzle sizes and different piezoelectric actuator frequencies (n > 100). l Literature study for continuously produced hollow core-shell microcapsules. Data from this study is indicated in red, while data from literature is indicated in black. CV < 10% Is indicated in filled data points, while CV > 10% is indicated in empty data points. Horizontal bars indicate the particle diameter range found in literature. Circular data points indicate studies without the use of oil, while triangular data points indicate studies with the use of oil. Scale bars represent 100 µm.

